Bitcoin Cash price analysis: Bears have control following three straight bullish days
- BCH/USD went down from $347.50 to $343.15 this Tuesday.
- The Elliot oscillator shows 12 straight bullish sessions.

BCH/USD has had a bearish start to the day as its price went down from $347.50 to $343.15. Before this Bitcoin Cash has had three straight bullish days, wherein the price went up from $328.25 to $347.50. The hourly price chart shows that the price went up to $353.65 this Monday before the bears kicked in and dropped the price down to $341.50. After that, the bulls came back and pulled the price up to $343.15.
BCH/USD daily chart
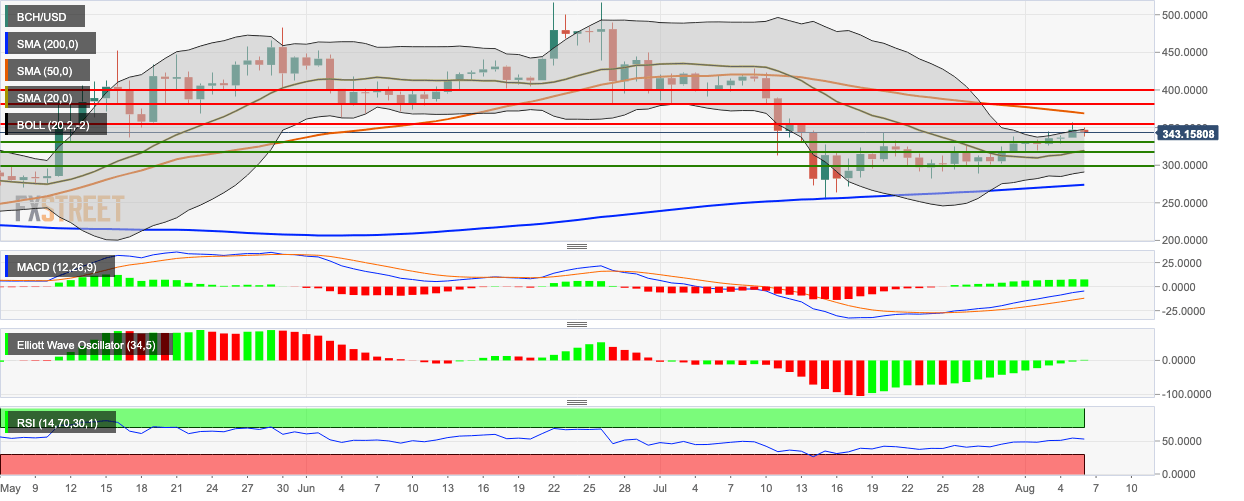
The daily price crept above the 20-day Bollinger band, indicating that it was overvalued before the bears stepped in and put it back inside the band. The narrowing of the Bollinger jaw shows decreasing market volatility. The moving average convergence/divergence (MACD) shows increasing bullish momentum. The Elliot oscillator has had 12 straight bullish sessions, while the relative strength index (RSI) indicator is trending around 53.
Author

Rajarshi Mitra
Independent Analyst
Rajarshi entered the blockchain space in 2016. He is a blockchain researcher who has worked for Blockgeeks and has done research work for several ICOs. He gets regularly invited to give talks on the blockchain technology and cryptocurrencies.


