Bitcoin bearish break testing $45k support zone and 38.2% Fib
-
Our original analysis on Bitcoin (BTC/USD) favored a bullish break above the 21 ema zone but a bearish swing is already testing the previous bottom near $47k.
-
On the 4 hour chart, price action seems to be building a bearish ABC (pink) zigzag pattern with 5 waves (grey) in wave A (pink).
-
The uptrend remains valid as long as price action stays above the 50% Fibonacci level. A break below places the uptrend on hold.

Bitcoin made a bearish breakout rather than a bullish break as we expected.
This shows how strong and important the 21 ema zone really is: price action was unable to break above the bearishly angled 21 emas. Let’s review the new situation.
Price charts and technical analysis
Our original analysis on Bitcoin (BTC/USD) favored a bullish break above the 21 ema zone but a bearish swing is already testing the previous bottom near $47k.
-
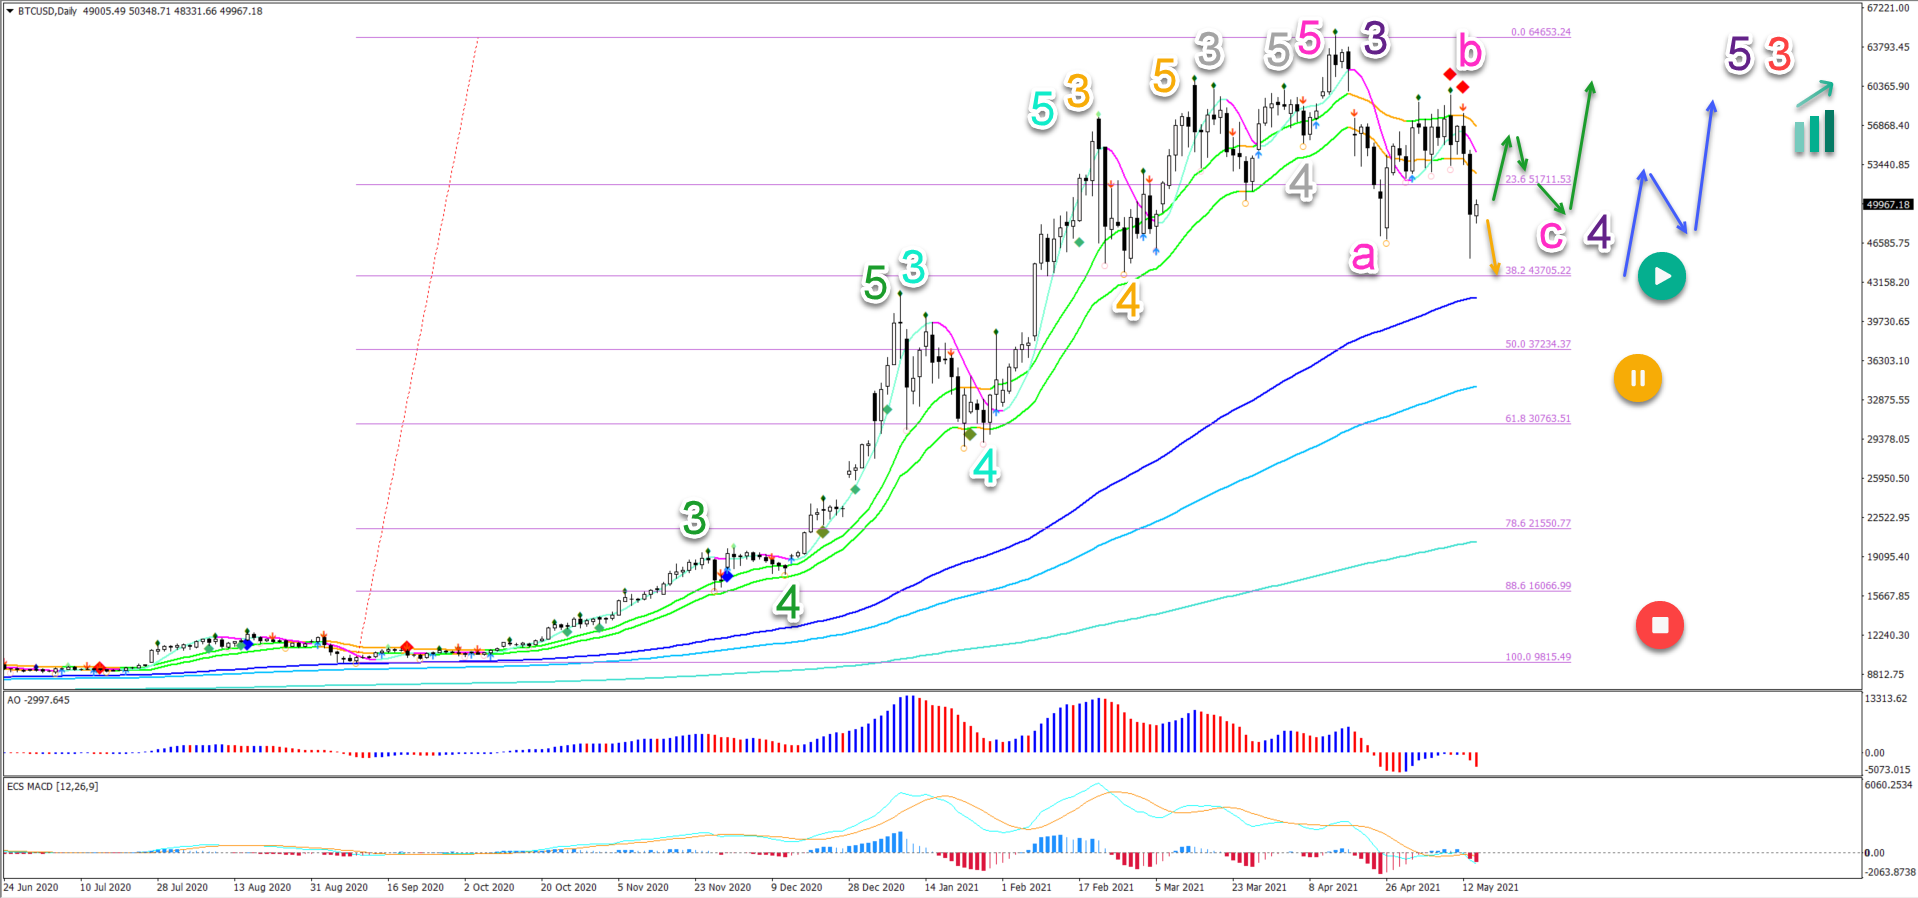
Price action made an immediate bearish swing instead as it used the 21 emas as a resistance zone.
-
This means that the price action seems to be completing a bearish ABC (pink) pattern as we expected, just a little bit sooner. Also, the wave B is weaker than expected.
-
If our outlook is correct, then the ABC (pink) should complete a wave 4 (purple) pullback.
-
The wave 4 (purple) could already be completed (green arrows) or make one lower low to tag and hit the 38.2% Fibonacci retracement level. A bounce confirms it (blue arrows).
-
The uptrend remains valid as long as price action stays above the 50% Fibonacci level. A break below places the uptrend on hold (orange button) and a deep retrace invalidate it (red button).
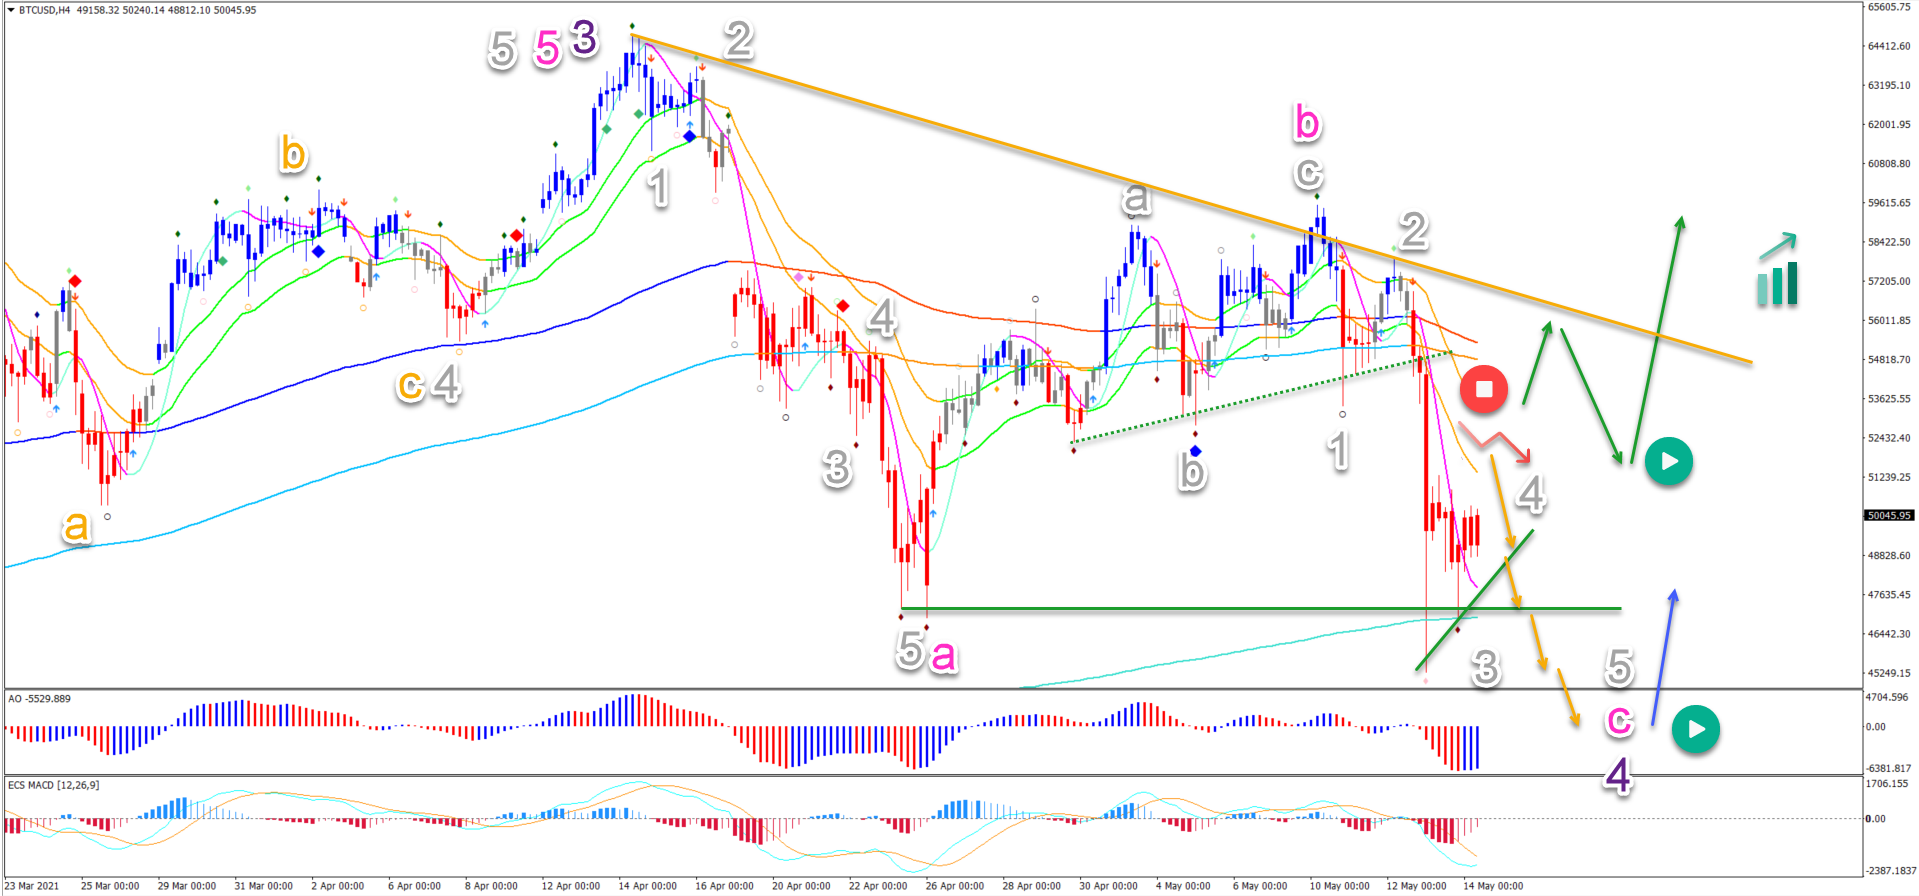
On the 4 hour chart, price action seems to be building a bearish ABC (pink) zigzag pattern with 5 waves (grey) in wave A (pink):
-
The current bullish bounce could be wave 4 (grey) in wave C (pink) as long as price action remains below the 21 ema zone.
-
A bullish breakout (green arrows) could invalidate the bearish wave 4-5 outlook and indicate an immediate uptrend.
-
A bearish breakout (orange arrows) could create one lower low to finish wave 4 (purple).
-
A bullish bounce after the lower low (blue arrow) could indicate the end of the retracement.
The analysis has been done with the ecs.SWAT method and ebook.
Author

Chris Svorcik
FS method
Chris Svorcik is a trader, analyst, and educator with over 15 years of experience in financial markets, specializing in moving averages, market structure, and price patterns.



