Binance Coin Price Forecast: BNB sits in the danger zone, according to on-chain metrics
- Binance Coin price stagnates inside squeezing Bollinger Bands after recently hitting an all-time high.
- A six-hour candlestick close above the upper band would project a potential target of $200.
- Multiple on-chain metrics turn bearish with MVRV indicator predicting that the parabolic rally might pop soon.
- Therefore, mounting selling pressure could drag BNB down to $100 or even $85.
Binance Coin price saw a massive 300% run-up since 2021 started. The parabolic bull run pushed BNB price from $35 to a whopping $148. Now, this rally awaits another volatile move, which could go either way.
Binance Coin price prepares for a volatile breakout
Binance Coin price is closely enveloped within the Bollinger Band on the 6-hour chart indicating a period of stagnation.
This indicator measures the price volatility and not the direction. Hence, a period of stagnation is followed by a sharp price movement in either direction. So, until BNB breaks out of the bands, it is in a no-trade-zone that ranges from $140 to $125.
A six-hour candlestick close above $140 could see the exchange token rally towards the resistance barrier at $200, which coincides with the 161.8% Fibonacci retracement level.
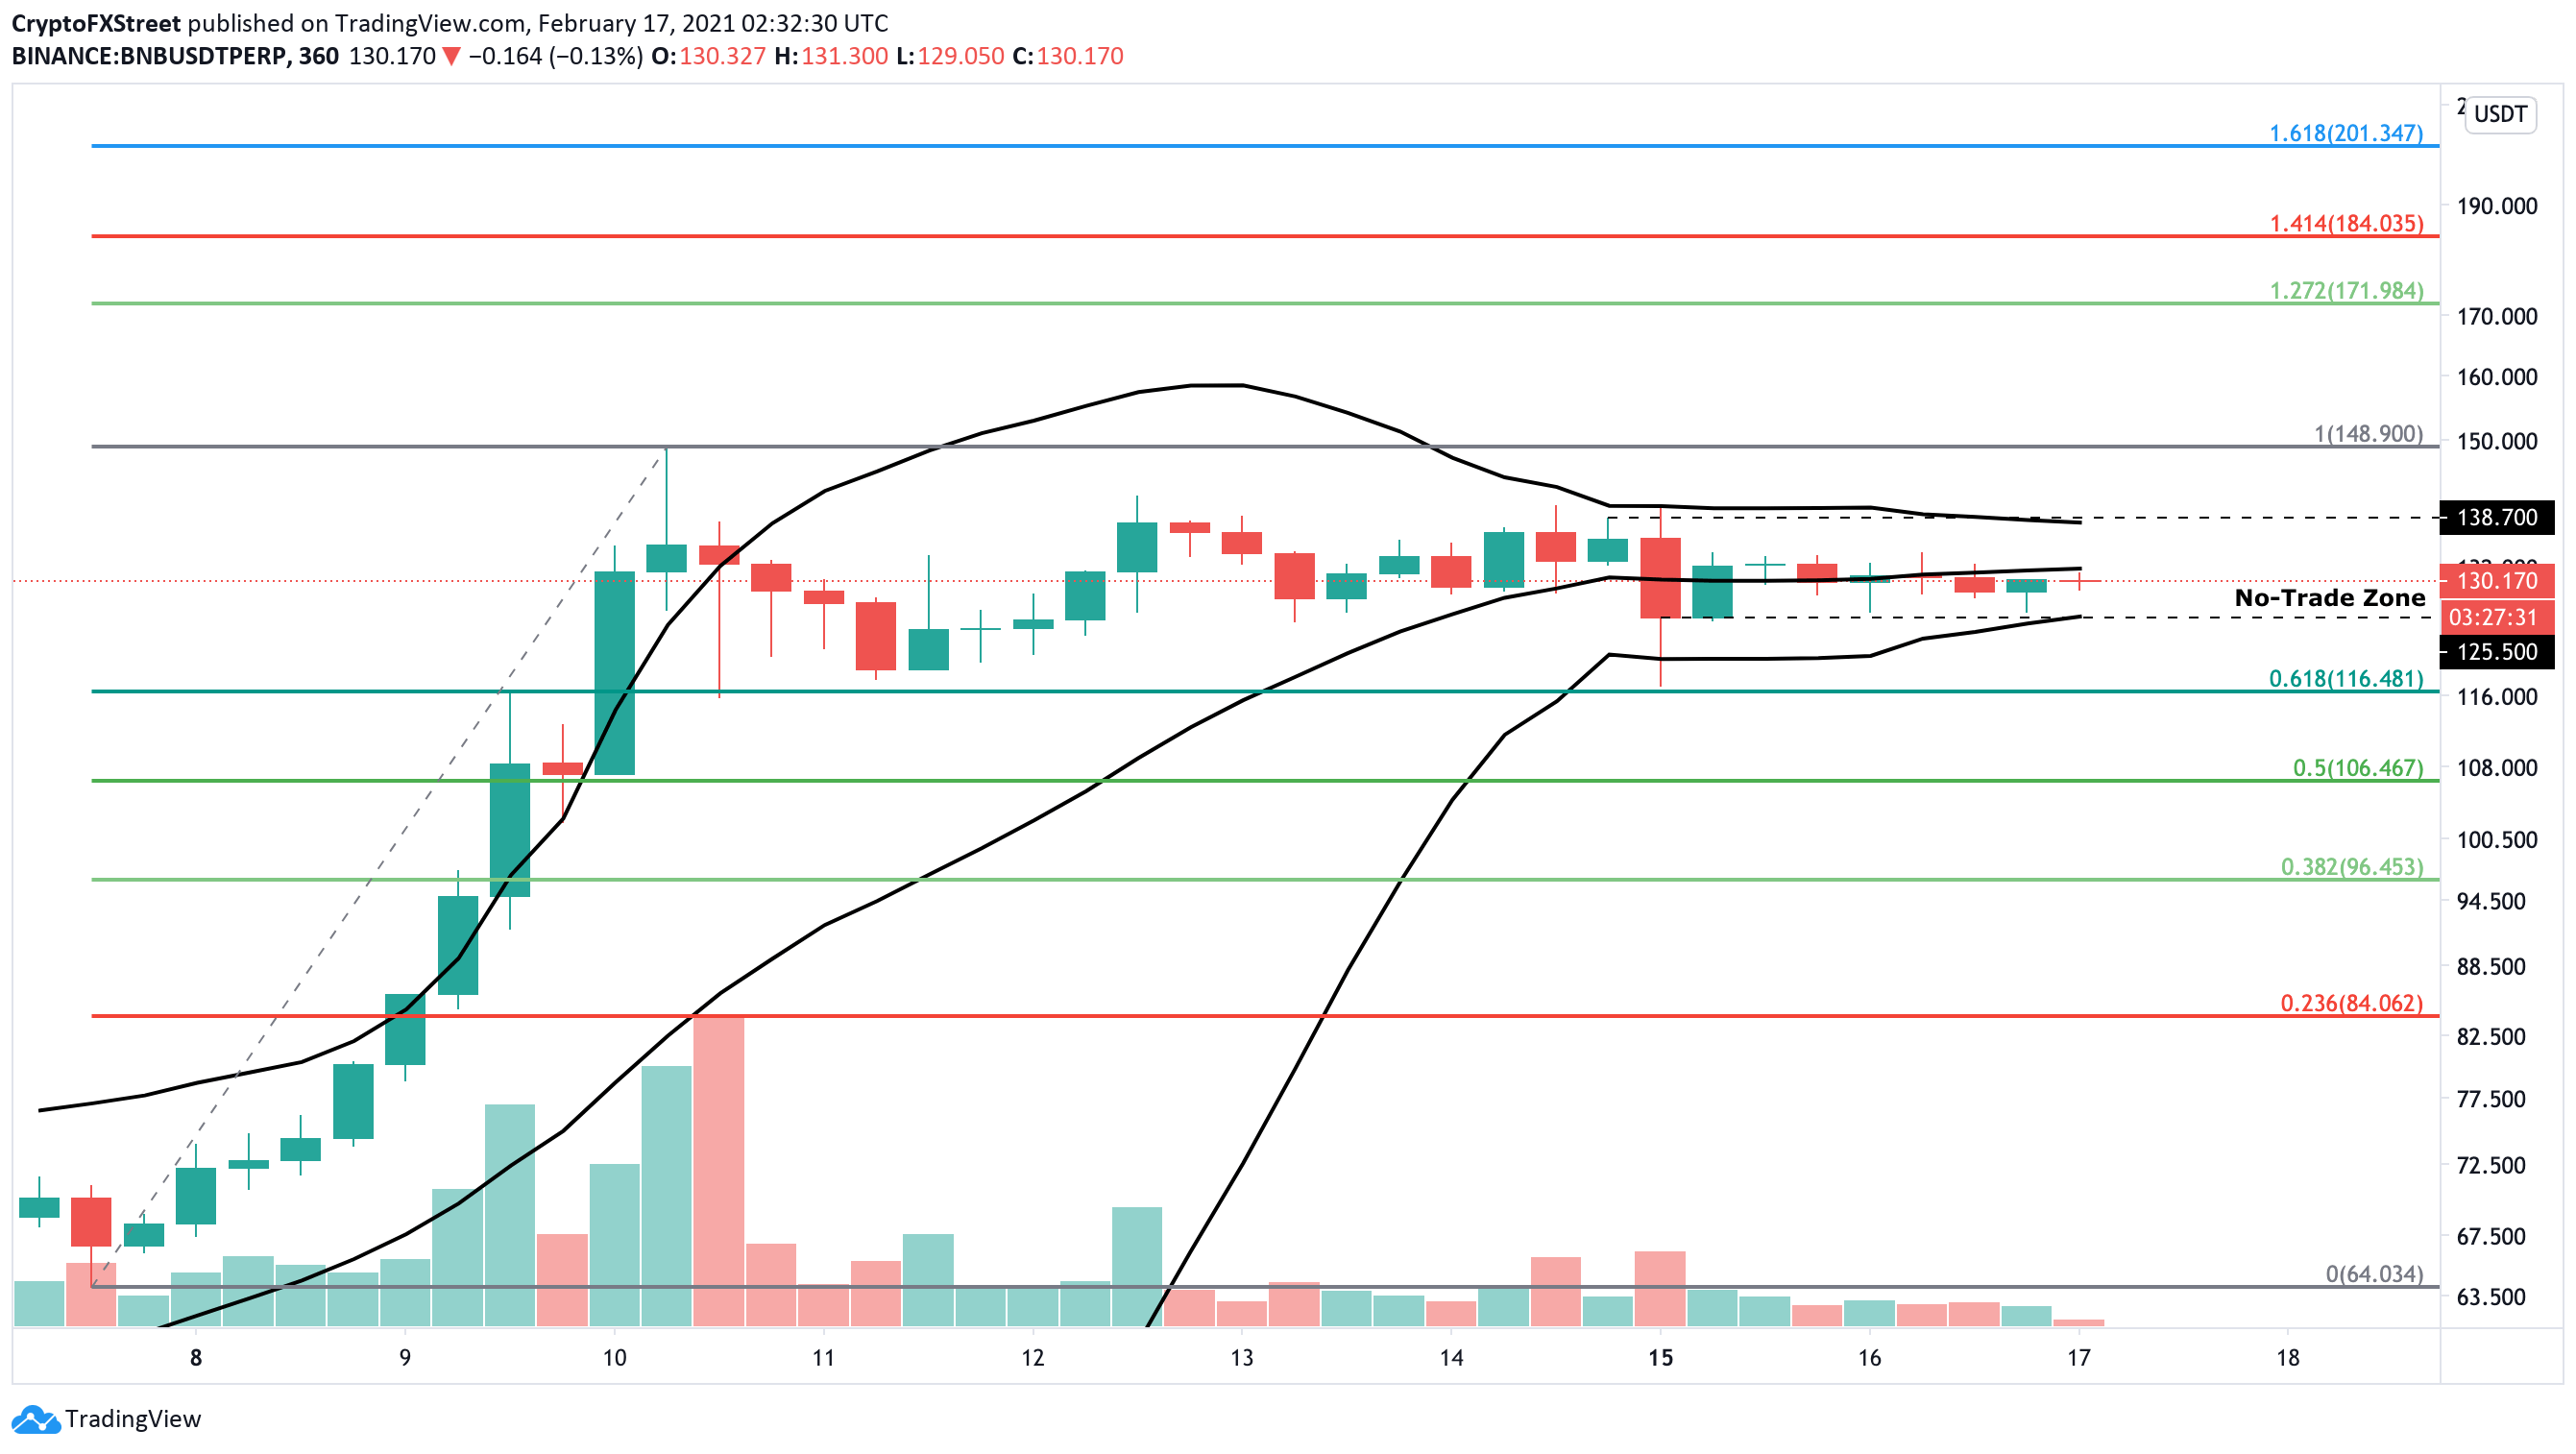
BNB/USDT 6-hour chart
Although a bullish scenario for Binance Coin seems likely, a culmination of technical and on-chain metrics suggests otherwise.
From a technical point of view, a failure to close above the upper band could see a reversal in price. Further selling pressure here, leading to a six-hour candlestick close below the no-trade zone’s lower range at $125, could trigger a sell-off leading to a steep correction.
Adding to this bearish thesis is a confluence of on-chain indicators that scream "sell."
“Danger Zone” hints uptrend's reversal
Binance Coin price has seen an increasing number of on-chain metrics turn bearish recently. For example, the on-chain BNB volume has reduced 75% from a peak of $7.13 billion on February 10.
A declining investor count transacting on the BNB blockchain notes an exodus of capital, which is also bearish.
Mirroring the on-chain volume metric is the BNB’s social volume, which has also seen a sharp drop of 90% between February 10 and 15.
Adding weight to this bearish thesis is the 37% reduction in the daily active addresses from 21,480 to 13,463 in the last five days.
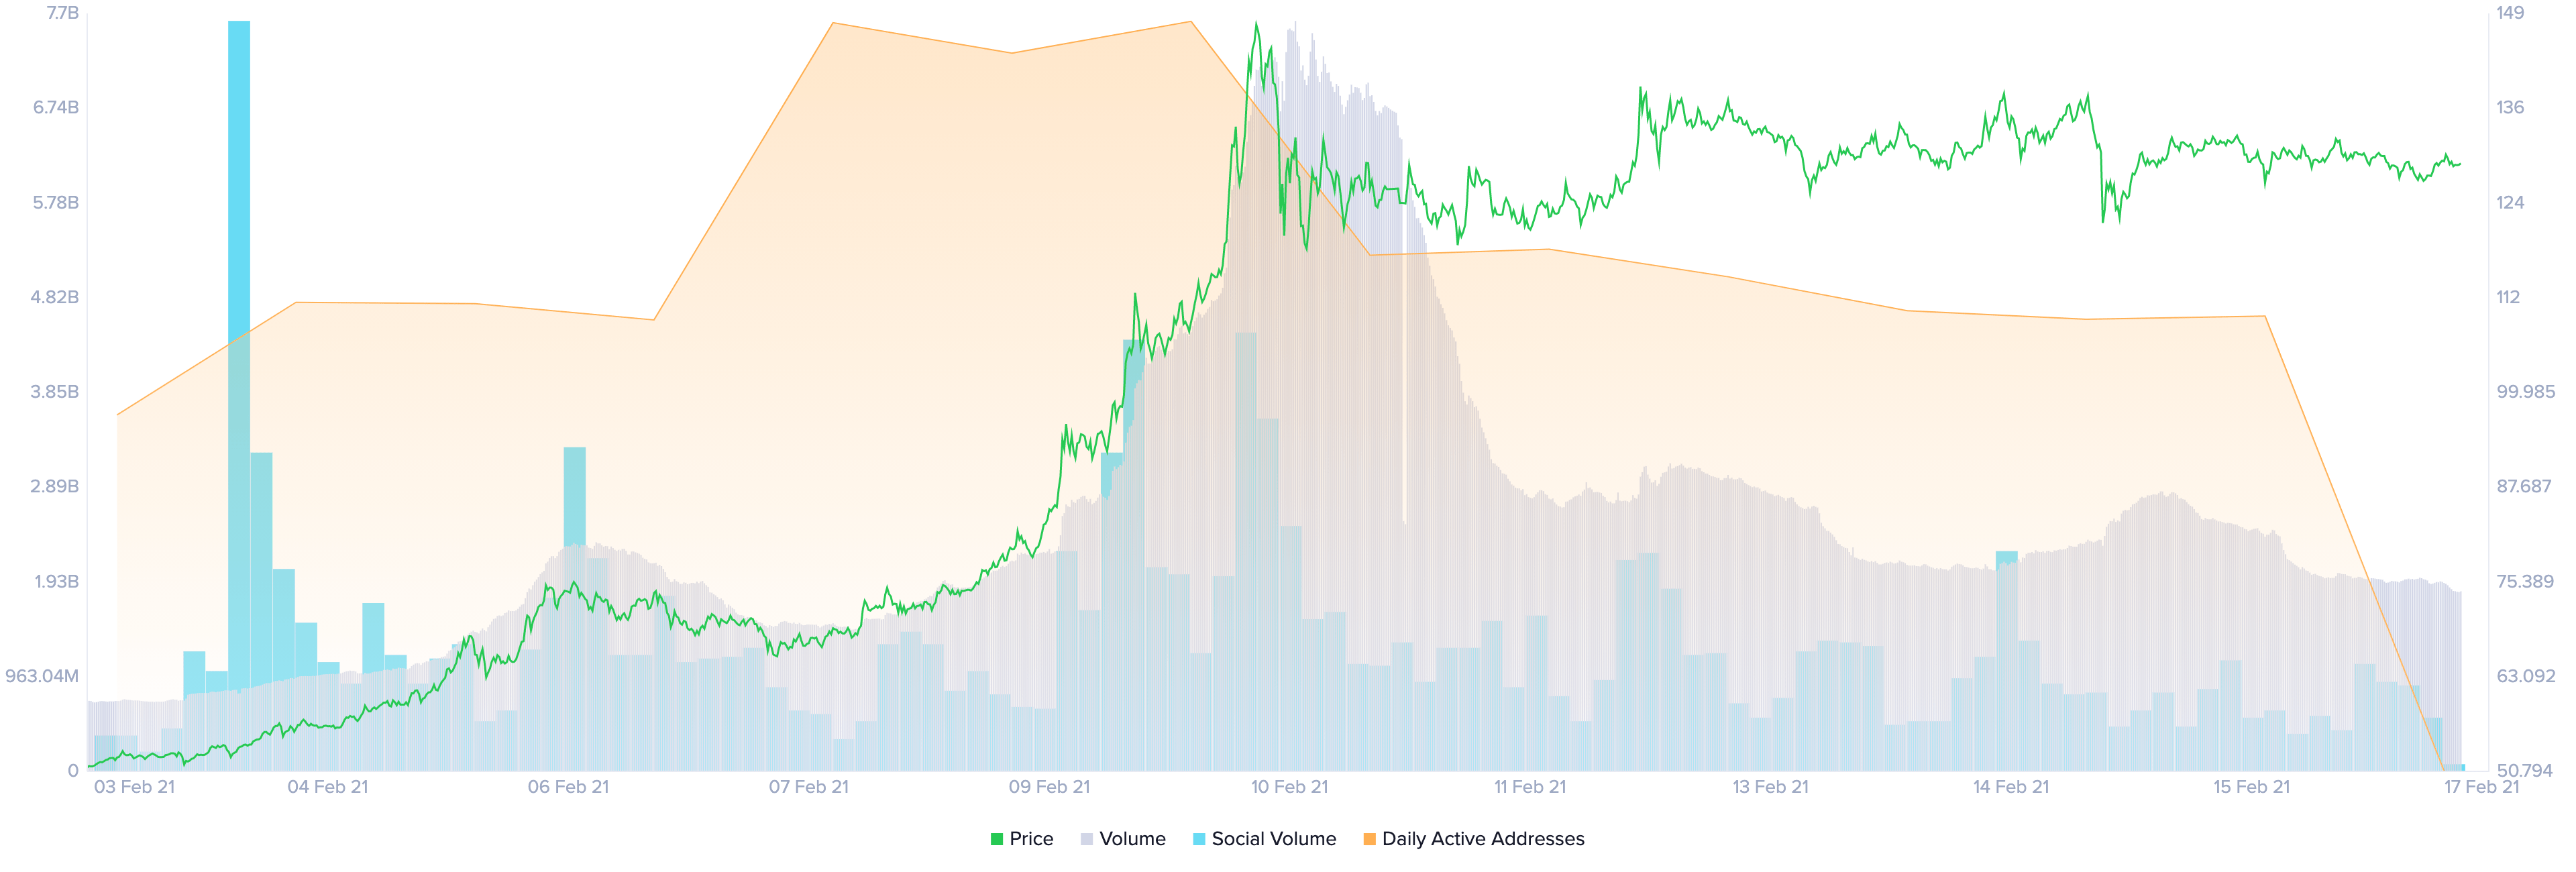
Binance Coin Volume v. Social Volume v. Daily Active User chart
All of the above points that investors are not interested in BNB at the current price levels and are either reallocating their funds or booking profits.
While BNB has only dropped 37% so far, its MVRV metric paints an even bearish picture.
According to the data analytics firm, Santiment, Binance Coin’s 30-day MVRV shows that the coin is in “Danger Zone,” suggesting a reversal in trend.
MVRV is the ratio of market capitalization to realized market capitalization.
By comparing the 30-day average of MVRV tops or bottoms for the top 20 altcoins to the actual 30-day MVRV, an asset’s price can be classified as in the “danger zone” or in the “opportunity zone.”
For BNB, the 30-day MVRV currently stands at 140%, far higher than the global 30-day average of 16.7%. Hence, investors should expect this rally to cooldown or perhaps revert to mean.
Binance Coin's 6-hour chart shows that a correction here could push the price to the immediate support at $100, which coincides with the 50% Fibonacci retracement level.
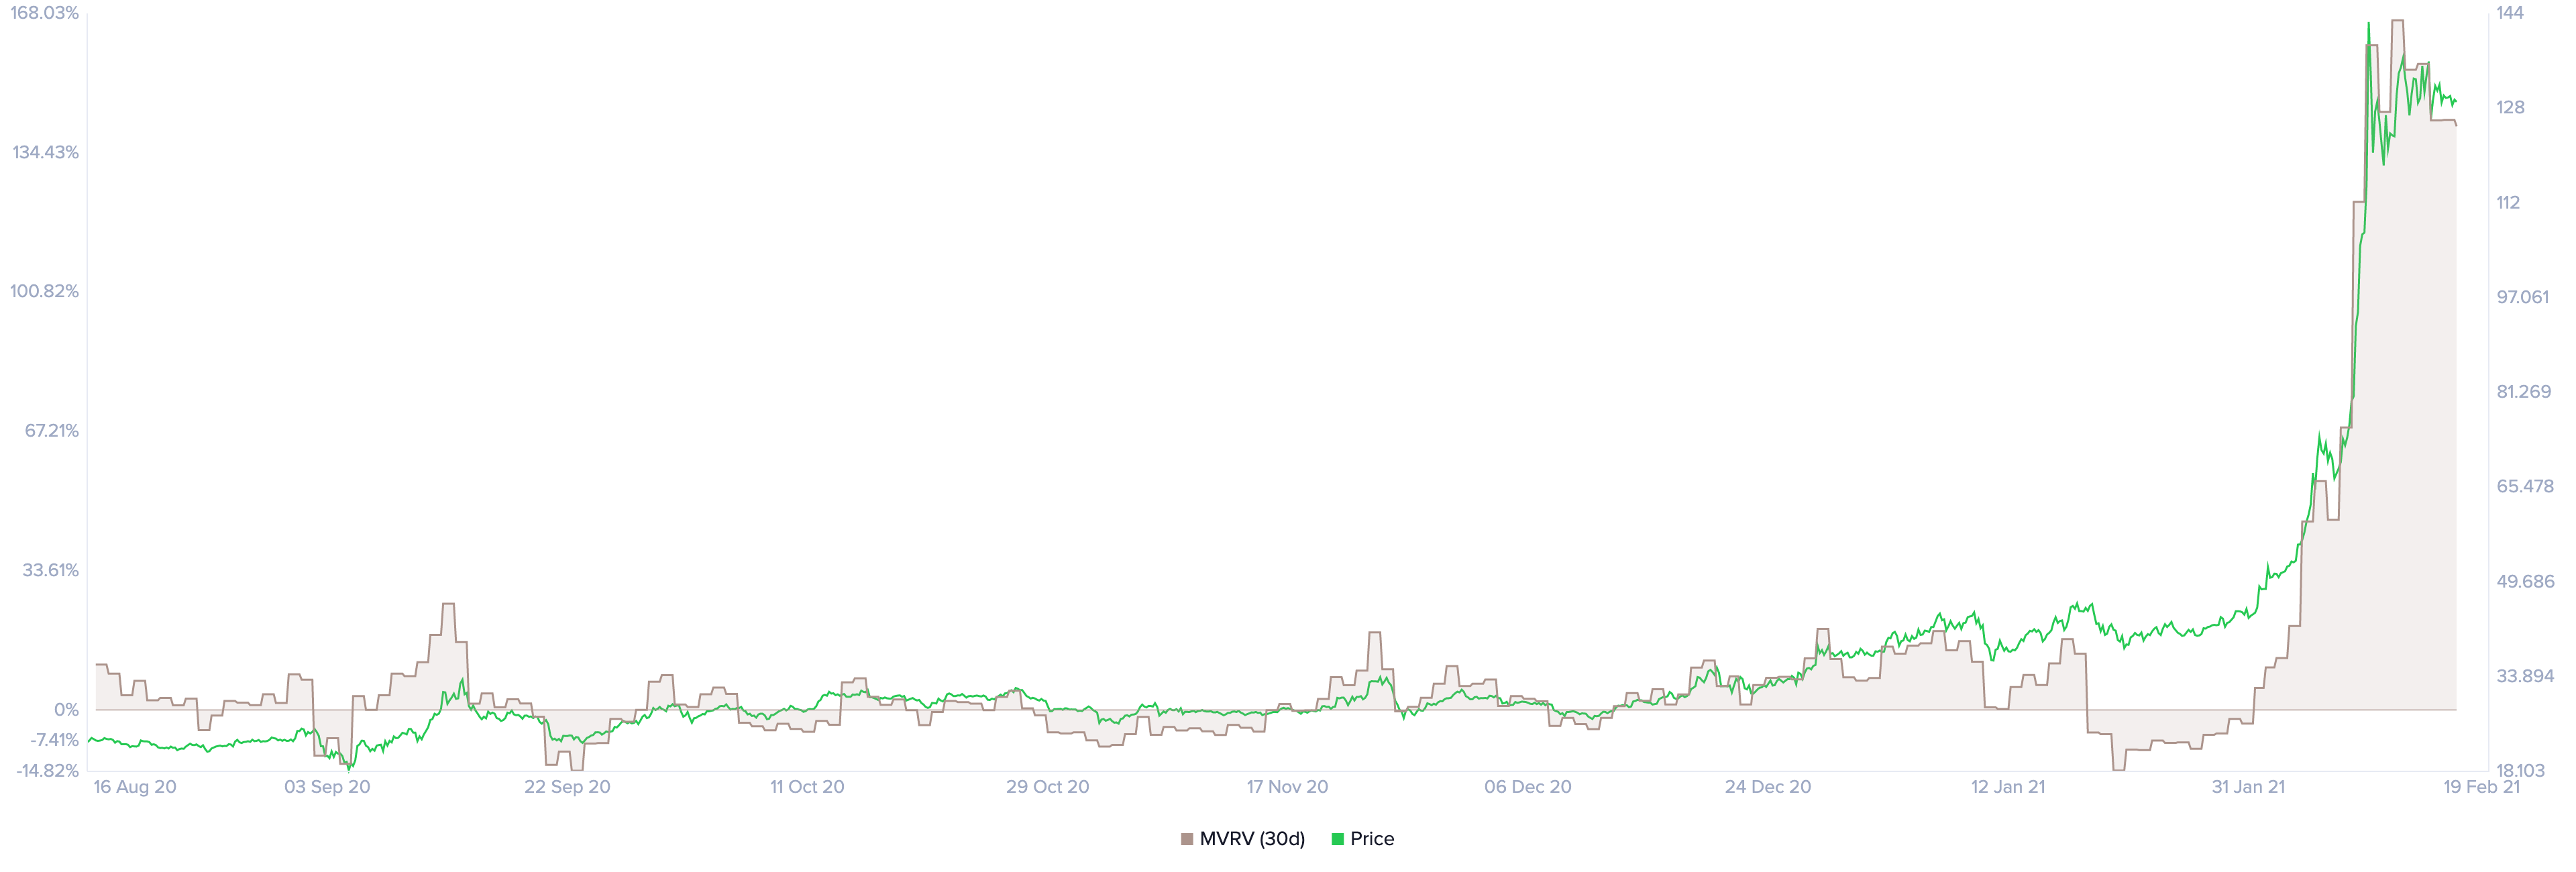
Binance Coin MVRV 30-day chart
If the bearish pressure mounts, then this correction could extend up to the next demand barrier at $85 or the 23.6% Fibonacci retracement level.
Author

Akash Girimath
FXStreet
Akash Girimath is a Mechanical Engineer interested in the chaos of the financial markets. Trying to make sense of this convoluted yet fascinating space, he switched his engineering job to become a crypto reporter and analyst.


