Binance coin poised for an 11% crash
- Binance coin price broke below the ascending trendline support on Wednesday, signaling a break in bullish market structure.
- On-chain data shows that BNB’s long-to-short ratio is less than one, signaling a bearish move.
- A daily candlestick close above $588.3 would invalidate the bearish thesis.
Binance Coin (BNB) breached its ascending trendline support on Wednesday and declines 3% on Thursday. On-chain analysis reveals a long-to-short ratio below one, indicating bearish sentiment and suggesting a potential price downturn for BNB in the days ahead.
BNB price is set for a decline following break below ascending trendline
BNB broke below the ascending trendline support on Wednesday and trades down 3% at $537.8 on Thursday. The trendline is drawn from joining multiple swing low levels between mid-March and late June, as shown in the daily chart below.
If this trendline holds as pullback resistance, BNB price could crash 11% and retest its March 19 low of $495.8.
The Relative Strength Index (RSI) and the Awesome Oscillator (AO) on the daily chart support this bearish thesis, as both indicators are below their respective neutral levels of 50 and zero. This suggests continued momentum favoring bears, potentially leading to a further decline in Binance coin price.
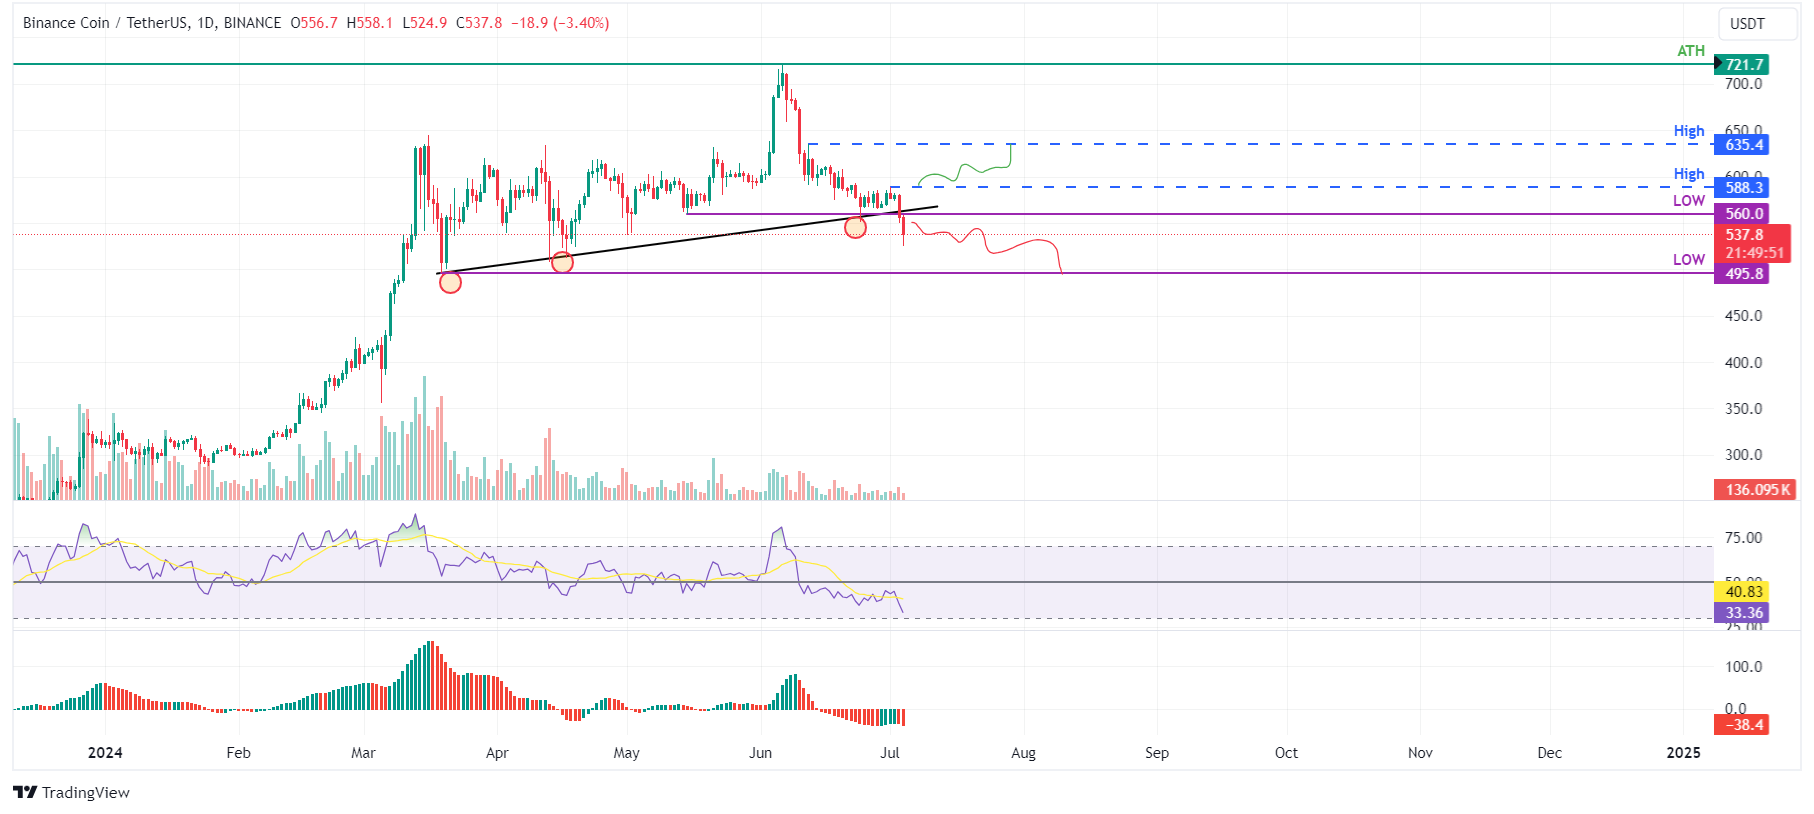
BNB/USDT daily chart
According to Coinglass, the long-to-short ratio metric gauges market sentiment and potential future price movements in the cryptocurrency markets based on traders' relative positions.
In BNB's case, the long-to-short ratio is 0.759. This ratio below one generally reflects bearish sentiment in the market as more traders anticipate the price of the asset to decline, further bolstering Binance coin's bearish outlook.
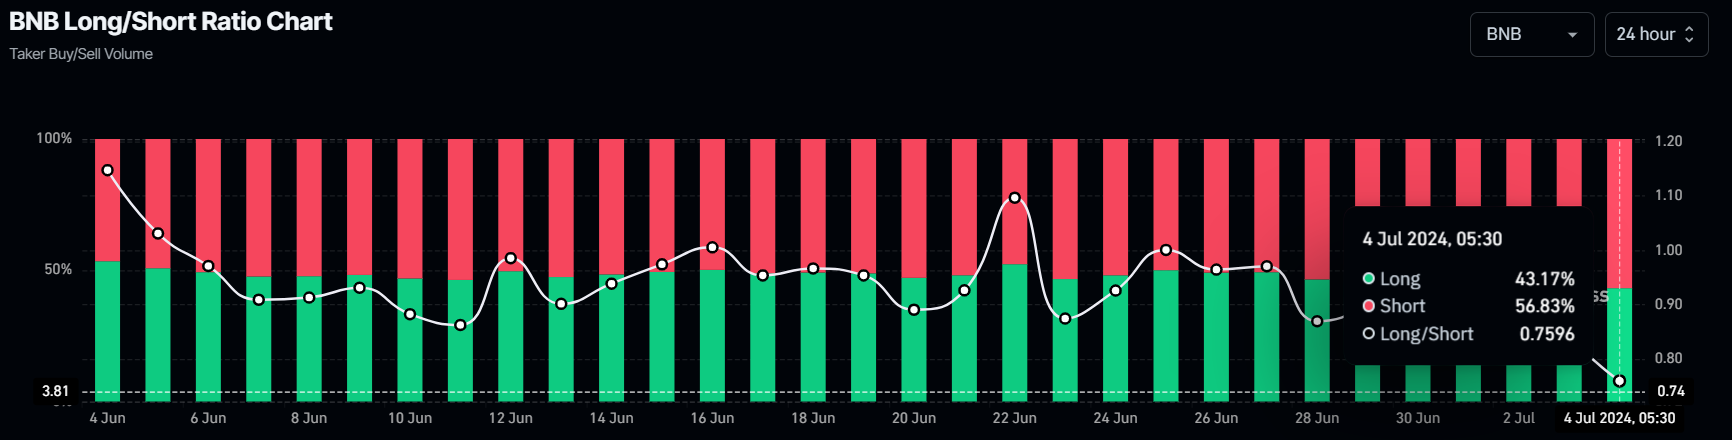
BNB Long/Short Ratio chart
However, if Binance coin's daily candlestick price closes above $588.3, the daily high from July 1 will produce a higher high and signal a break in the market structure. This move would invalidate the aforementioned bearish thesis, potentially triggering an 8% rise to the previous resistance level of $635.4 from the daily high on June 12.
Author

Manish Chhetri
FXStreet
Manish Chhetri is a crypto specialist with over four years of experience in the cryptocurrency industry.


![Hyperliquid representatives, Trade[XYZ] meet SEC Crypto Task Force to discuss digital asset regulation](https://editorial.fxsstatic.com/images/i/Hyperliquid_Bull.png)
