- ApeCoin price fluctuates around ascending trendline.
- APE price sees bulls sidelined with RSI flatlining.
- Expect a bullish breakout towards $15.74, putting 11% gains on the table.
ApeCoin (APE) is a bit of an outlier versus major cryptocurrencies as price has taken a slight turn to the downside, while Bitcoin and Ethereum have been popping higher since last weekend. APE price has been on the verge of breaking below the green ascending trend line the past few days but sees neither bulls nor bears trying to dictate price action as the Relative Strenght Index (RSI) is flatlining. Expect a bullish breakout towards $15.74 with current tailwinds soon to be materializing in APE price action.
ApeCoin price awaits tailwinds to materialize
ApeCoin price hit the 78.6% Fibonacci level at $15.74 but failed in the making as investors are putting more money in significant cryptocurrencies and stocks, where altcoins like APE are still yet to prove their track record. With interest fading, both demand and supply are drying up with the RSI flatlining, pointing to a balanced equilibrium between both parties. It comes as no surprise that price action is crossing along the green ascending trend line during the ASIA PAC session, awaiting a sense of direction.
APE price is nevertheless set for a bullish breakout as global markets are on the front foot and are frontrunning a positive outcome in the Ukraine-Russia situation. With stock markets up over 1% intraday, expect this positive mood to spill over into ApeCoin. This will lift price action in favor of bulls, with the RSI ticking up above 50 and could see APE price swing back to $15.74 and be on the cusp of closing above the 78.6% Fibonacci level.
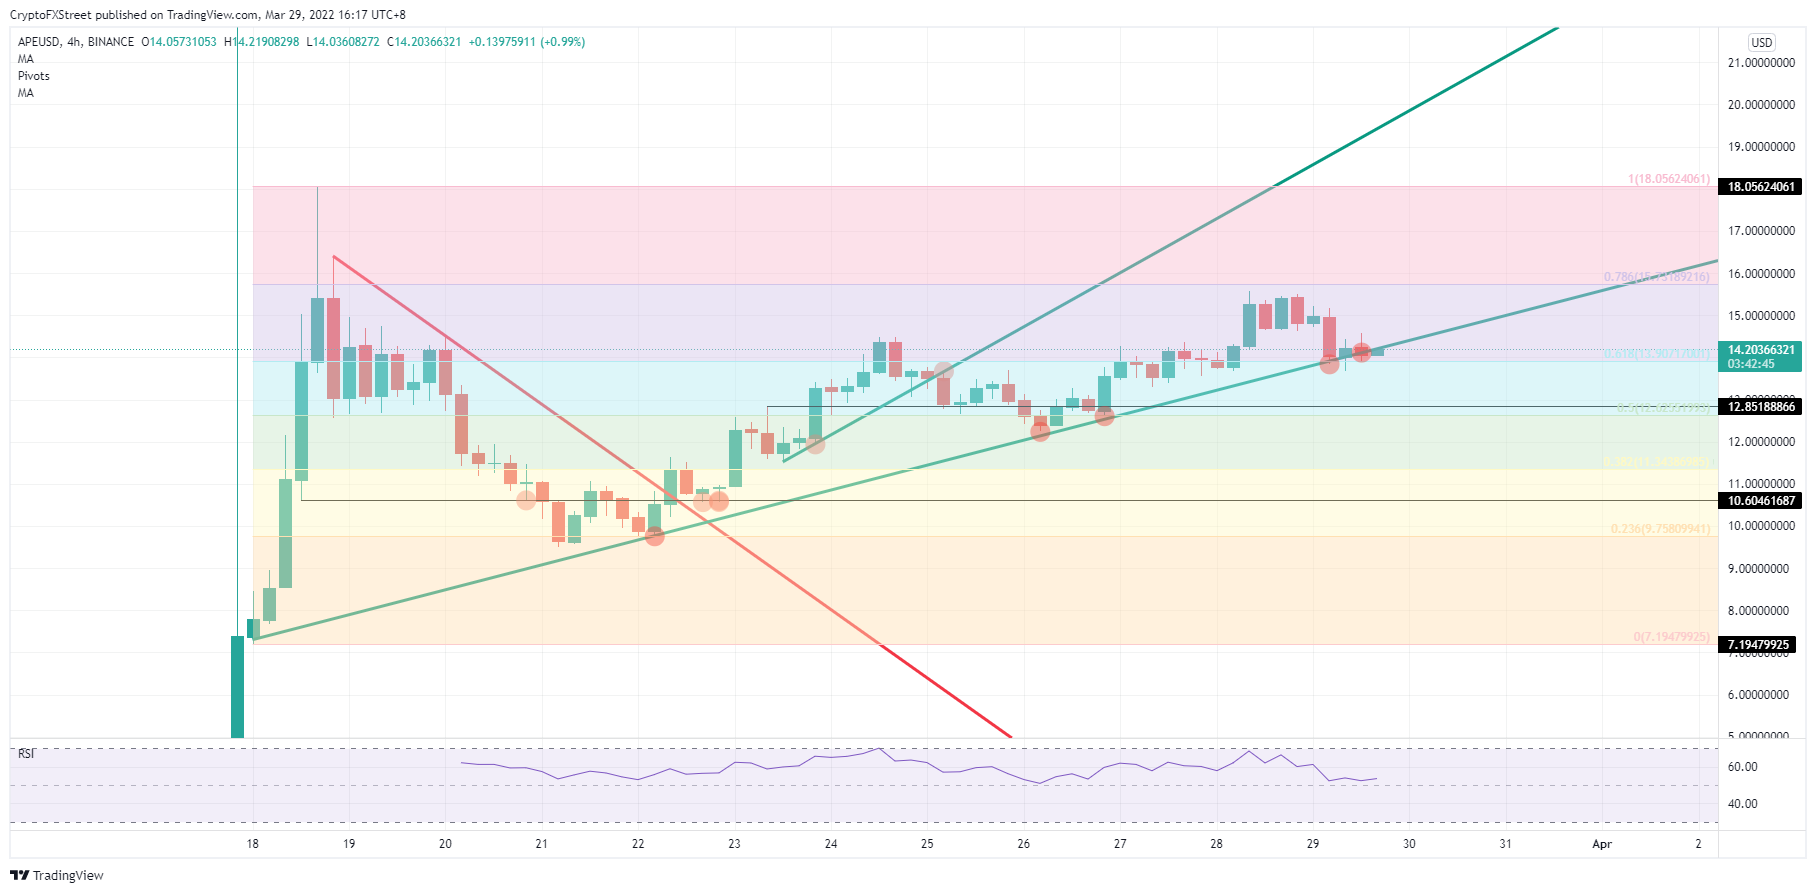
APE/USD 4H-chart
With price action hovering around that green descending trend line past 12 hours, the risk could be that price fades away a bit too wide to the downside, and could see bulls swinging to the sell-side to cut their losses or take rapid profit, which would spiral into a quick sell-move. That would mean APE price to retrace back to $12.85 and near the 50% Fibonacci at $12.63. With that move, the RSI would dip below 50 and see bulls awaiting the 38.2% Fibonacci level at $1.34 to show up before getting in long again.
Information on these pages contains forward-looking statements that involve risks and uncertainties. Markets and instruments profiled on this page are for informational purposes only and should not in any way come across as a recommendation to buy or sell in these assets. You should do your own thorough research before making any investment decisions. FXStreet does not in any way guarantee that this information is free from mistakes, errors, or material misstatements. It also does not guarantee that this information is of a timely nature. Investing in Open Markets involves a great deal of risk, including the loss of all or a portion of your investment, as well as emotional distress. All risks, losses and costs associated with investing, including total loss of principal, are your responsibility. The views and opinions expressed in this article are those of the authors and do not necessarily reflect the official policy or position of FXStreet nor its advertisers. The author will not be held responsible for information that is found at the end of links posted on this page.
If not otherwise explicitly mentioned in the body of the article, at the time of writing, the author has no position in any stock mentioned in this article and no business relationship with any company mentioned. The author has not received compensation for writing this article, other than from FXStreet.
FXStreet and the author do not provide personalized recommendations. The author makes no representations as to the accuracy, completeness, or suitability of this information. FXStreet and the author will not be liable for any errors, omissions or any losses, injuries or damages arising from this information and its display or use. Errors and omissions excepted.
The author and FXStreet are not registered investment advisors and nothing in this article is intended to be investment advice.
Recommended Content
Editors’ Picks

Top 3 Price Prediction Bitcoin, Ethereum, Ripple: BTC consolidates while ETH and XRP show some strength
Bitcoin (BTC) consolidated between $94,000 and $100,000 in the last nine days. Ethereum (ETH) and Ripple (XRP) prices stood relatively stronger and have gained nearly 3% and 7%, respectively, this week.

Trump's US reciprocal tariffs pause fails to improve Bitcoin and crypto market outlook
Bitcoin (BTC) and top cryptos halted their declines following a pause in President Donald Trump's reciprocal tariff plans, which were originally scheduled to go live on Thursday.

Ripple vs SEC battle nears end as the regulator acknowledges Grayscale XRP ETF filing
Ripple's XRP is up 4% in the early hours of Friday following the Securities and Exchange Commission (SEC) acknowledgment of Grayscale's 19b-4 filing to convert its XRP Trust to an ETF.

200,000 New Investors Buy Ripple (XRP) 30-Days After Gensler’s Farewell: What Next for Stellar (XLM)?
Ripple (XRP) price consolidated around $2.40 on Thursday, up 11% since Monday, technical indicators suggest Stellar (XLM) has joined the rally.

Bitcoin: BTC consolidates before a big move
Bitcoin's (BTC) price has been consolidating between $94,000 and $100,000 for the last ten days, and, when writing on Friday, it hovers around $97,000. Despite this consolidation, US Bitcoin spot Exchange Traded Funds (ETFs) data recorded a total net outflow of $650.80 million until Thursday, hinting signs of weakness among institutional investors.

The Best Brokers of the Year
SPONSORED Explore top-quality choices worldwide and locally. Compare key features like spreads, leverage, and platforms. Find the right broker for your needs, whether trading CFDs, Forex pairs like EUR/USD, or commodities like Gold.