Algorand price presents buy opportunity before surging to $1.40
- Algorand price drops more than 9% during Friday morning crypto sell-off, then recovers the entire loss.
- Bullish reversal candlestick and oscillator reading indicate a bullish move in the future.
- Downside risks remain but are minimal relative to possible gains.

Algorand price may have completed its final major drop to begin, at least, a corrective move towards the $1.40 resistance zone.
Algorand price set to bounce over 30% from the Friday lows
Algorand price action during the Friday trading session was the definition of a whipsaw event. The bulk of the intraday loss happened over 1.5 hours when ALGO dropped from $1.13 to $1.05 but then spent the next two hours rallying back to $1.17. This price action is a reversal candlestick pattern known as a spinning top.
The spinning top candlestick pattern has a long wick below the body and a slightly shorter wick above. Spinning tops are often up to broad interpretation and can often be correctly (or incorrectly) classified as dojis. However, regardless of the nomenclature, this candlestick's interpretation suggests selling pressure has abated and that a corrective move is likely.
The extremely oversold level in the Optex Bands oscillator contributes to the probability of a bullish reversal. The Optex Bands have been sitting in the highly oversold region for most of January. Another contributor to a bullish outlook for Algorand price is the Composite Index reaching historical lows and historical support zones. Finally, the Relative Strength Index is just a hair above the first oversold level in a bear market (30).
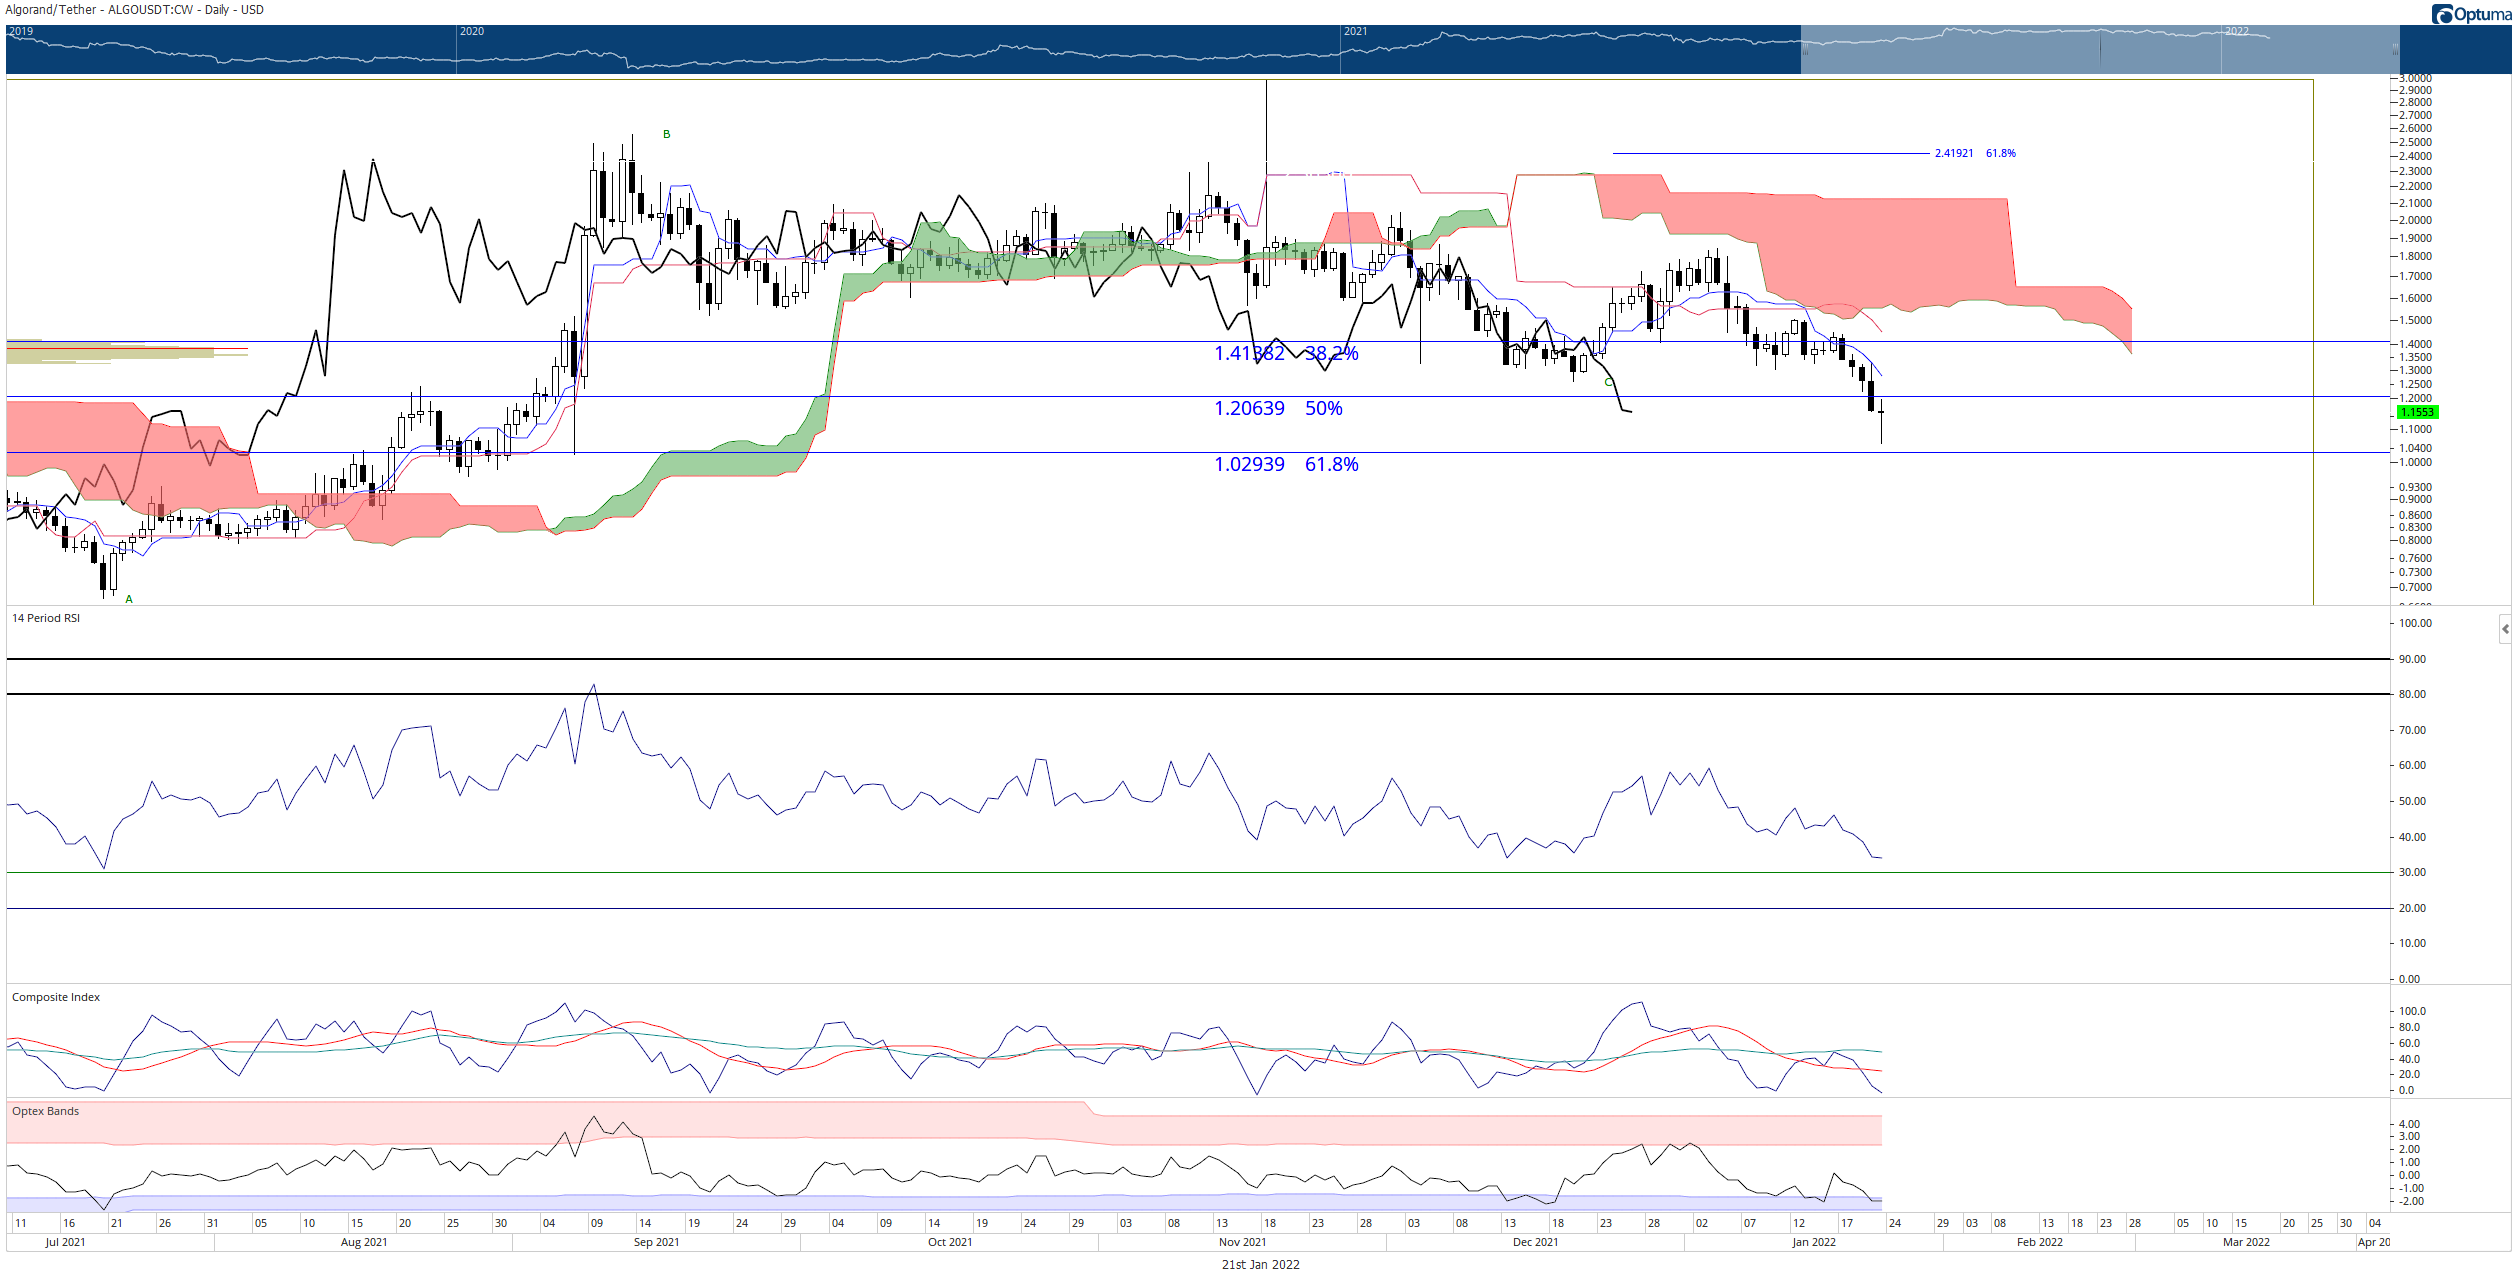
ALGO/USDT Daily Ichimoku Kinko Hyo Chart
Upside potential is limited to the Kijun-Sen, 38.2% Fibonacci retracement, and the Volume Point Of Control at the $1.40 level. Traders should expect selling pressure to come in at that value area. Downside risks should be somewhat limited given Algorand price's extremes have already been visited. However, any close below the 61.8% Fibonacci retracement at $1.02 would have a good chance of initiating a capitulation move towards the $0.80 value area.
Author

Jonathan Morgan
Independent Analyst
Jonathan has been working as an Independent future, forex, and cryptocurrency trader and analyst for 8 years. He also has been writing for the past 5 years.


