|

Algorand Price Forecast: Heading to a 10% crash

  • Algorand price tests the daily support $0.161 level.
  • ALGO’s Relative Strength Index (RSI) and Awesome Oscillator (AO) both signal a bearish momentum.
  • A daily candlestick close above $0.172 would invalidate this bearish thesis.

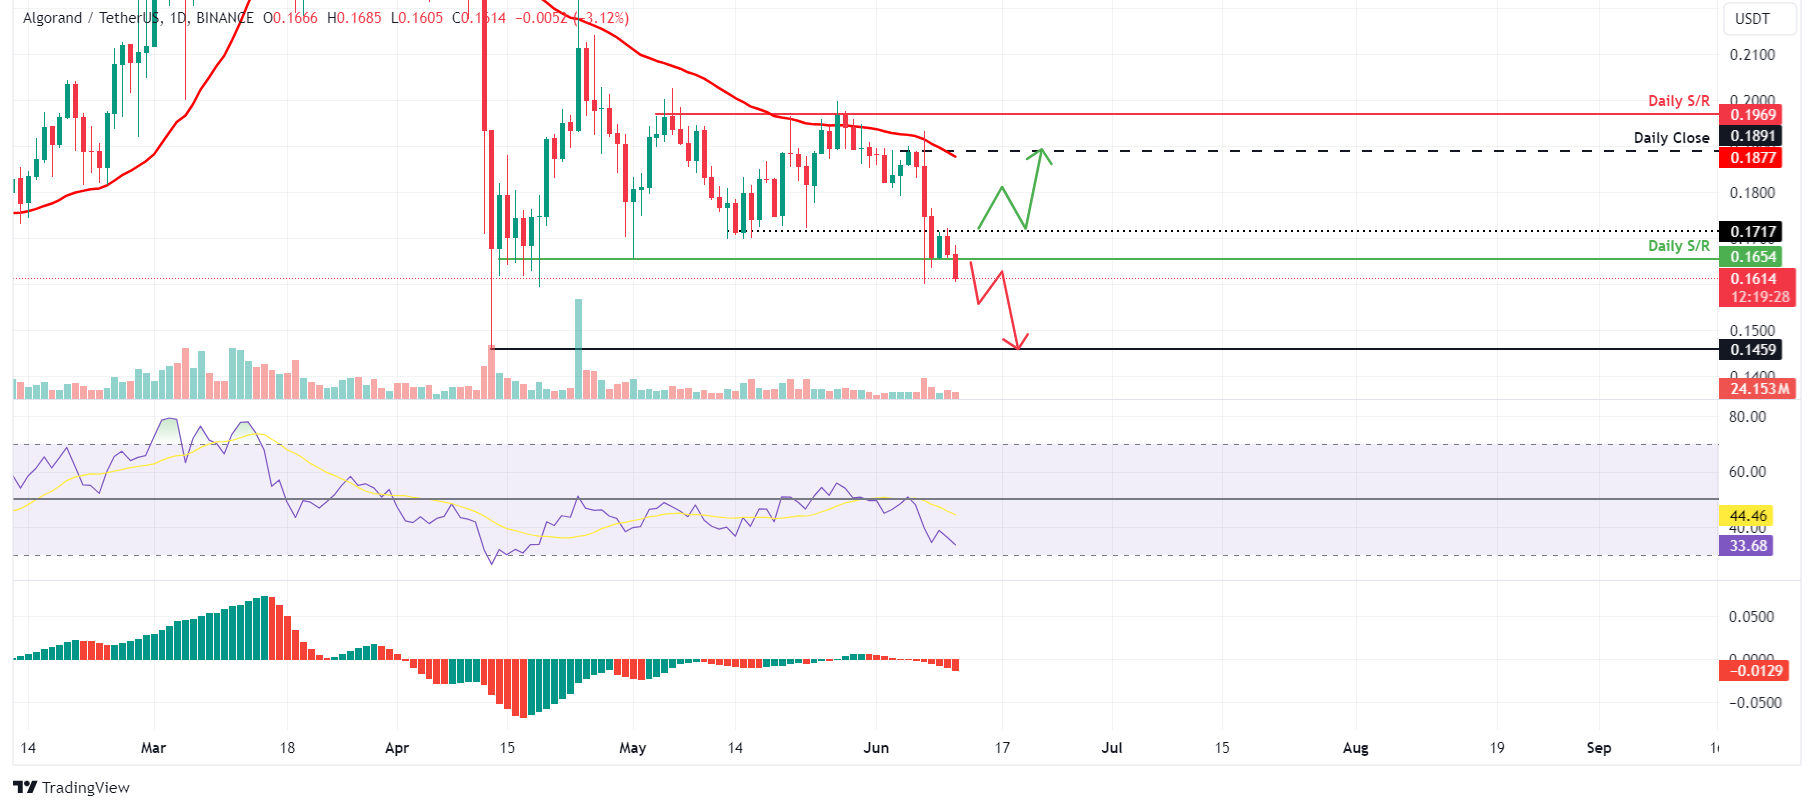
Algorand (ALGO) price is about to break below the daily support level at $0.161 on Tuesday, extending its two-week decline after being rejected near $0.200 on May 27. The Relative Strength Index (RSI) and Awesome Oscillator (AO) momentum indicators both signal a bearish momentum.

Algorand poise for 10% crash

Algorand's price crashed 17% from Friday’s high at $0.193 to a low of $0.1600 after facing resistance around the 50-day Exponential Moving Average(EMA). ALGO’s price extends its decline on Tuesday and tests the key daily support level.

If ALGO's daily candlestick closes below the daily support level of $0.161, it could crash 10% and retest its previous support at the April 13 low at $0.145.

The Relative Strength Index (RSI) and Awesome Oscillator (AO) support this bearish outlook, as both are below their respective mean levels of 50 and 0 and signaling bearish momentum.
ALGO/USDT 1-day chart

ALGO/USDT 1-day chart

On the contrary, if the Algorand price produces a daily candlestick close above the Monday high at $0.172, it would create a higher high in the daily time frame, invalidating the bearish thesis. This bullish development could see ALGO rally 10% to the daily resistance level of $0.189.

Author

Manish Chhetri

Manish Chhetri is a crypto specialist with over four years of experience in the cryptocurrency industry.


More from Manish Chhetri
Share:

Editor's Picks

Pi Network extends consolidation as bulls eye $0.10

Pi Network price holds steady on Friday, maintaining a consolidating tone for three consecutive days. Mild retail strength in the PI token remains stable, with Open Interest above $9 million, while social buzz eases.

Bitcoin Weekly Forecast: Hormuz uncertainty clouds BTC outlook

Bitcoin trades around $62,900 on Friday, down over 3% so far this week, but signs of stabilization are emerging. Tensions in the Strait of Hormuz are keeping Oil prices and the war-risk premium elevated, supporting the US Dollar and weighing on BTC.

Crypto Today: Bitcoin, Ethereum, and Ripple risk steeper correction as bearish pressure mounts

Bitcoin trades below $63,000 on Friday, projecting a downside bias as selling pressure resurfaces. Ethereum and Ripple also take a bearish path, risking a drop below the 50-day Exponential Moving Average at $1,856 and the $1.00 psychological support, respectively.

Bitcoin SV Price Forecast: BSV hits three-month high, eyeing 200-day EMA breakout

Bitcoin SV (BSV) is up nearly 2% on Friday, extending a steady upward trend over the last two weeks. Retail strength builds in BSV amid multiple vulnerabilities found in the Bitcoin ecosystem.

Bitcoin: Hormuz uncertainty clouds BTC outlook
Bitcoin (BTC) trades around $62,900 at the time of writing on Friday, down over 3% so far this week amid cautious institutional demand and persistent geopolitical uncertainty. While BTC shows signs of stabilization, elevated Oil prices and tensions in the Strait of Hormuz continue to weigh on risk sentiment, keeping the Crypto King’s near-term outlook under pressure.

