AAVE derivatives volume surges after short trades spiked
- AAVE derivatives volume more than doubled early Monday in Asia due to a spike in short trades.
- The liquidity protocol saw a 6% rise in the price of its native token during the same period.
- AAVE's RSI indicates a possible trend reversal as the index hovers in the overbought range.

AAVE derivatives registered around 50% surge in derivatives trading volume at the beginning of the week, an increase that reached more than 100% early Monday in Asia, due to a sharp increase in short trades. Open interest has also experienced a significant increase, with the price indicating a strong performance in the last seven-day period. Whether the rally will continue depends on the selling pressure that the liquidity protocol might face.
AAVE short liquidations spike
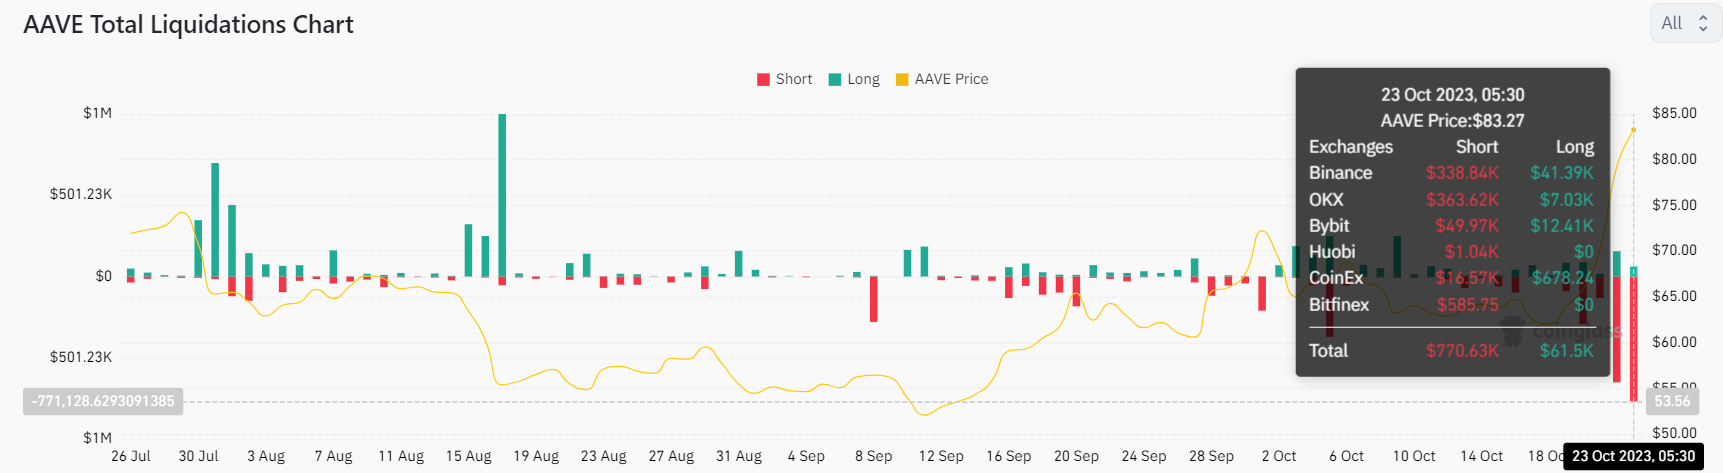
Based on Coinglass data, the Long/Short Ratio for the period for the AAVE/USDT pair is 1.01. In the last 24 hours, long positions faced liquidations of close to $60,000, while short positions had significantly higher liquidations of $770,000.
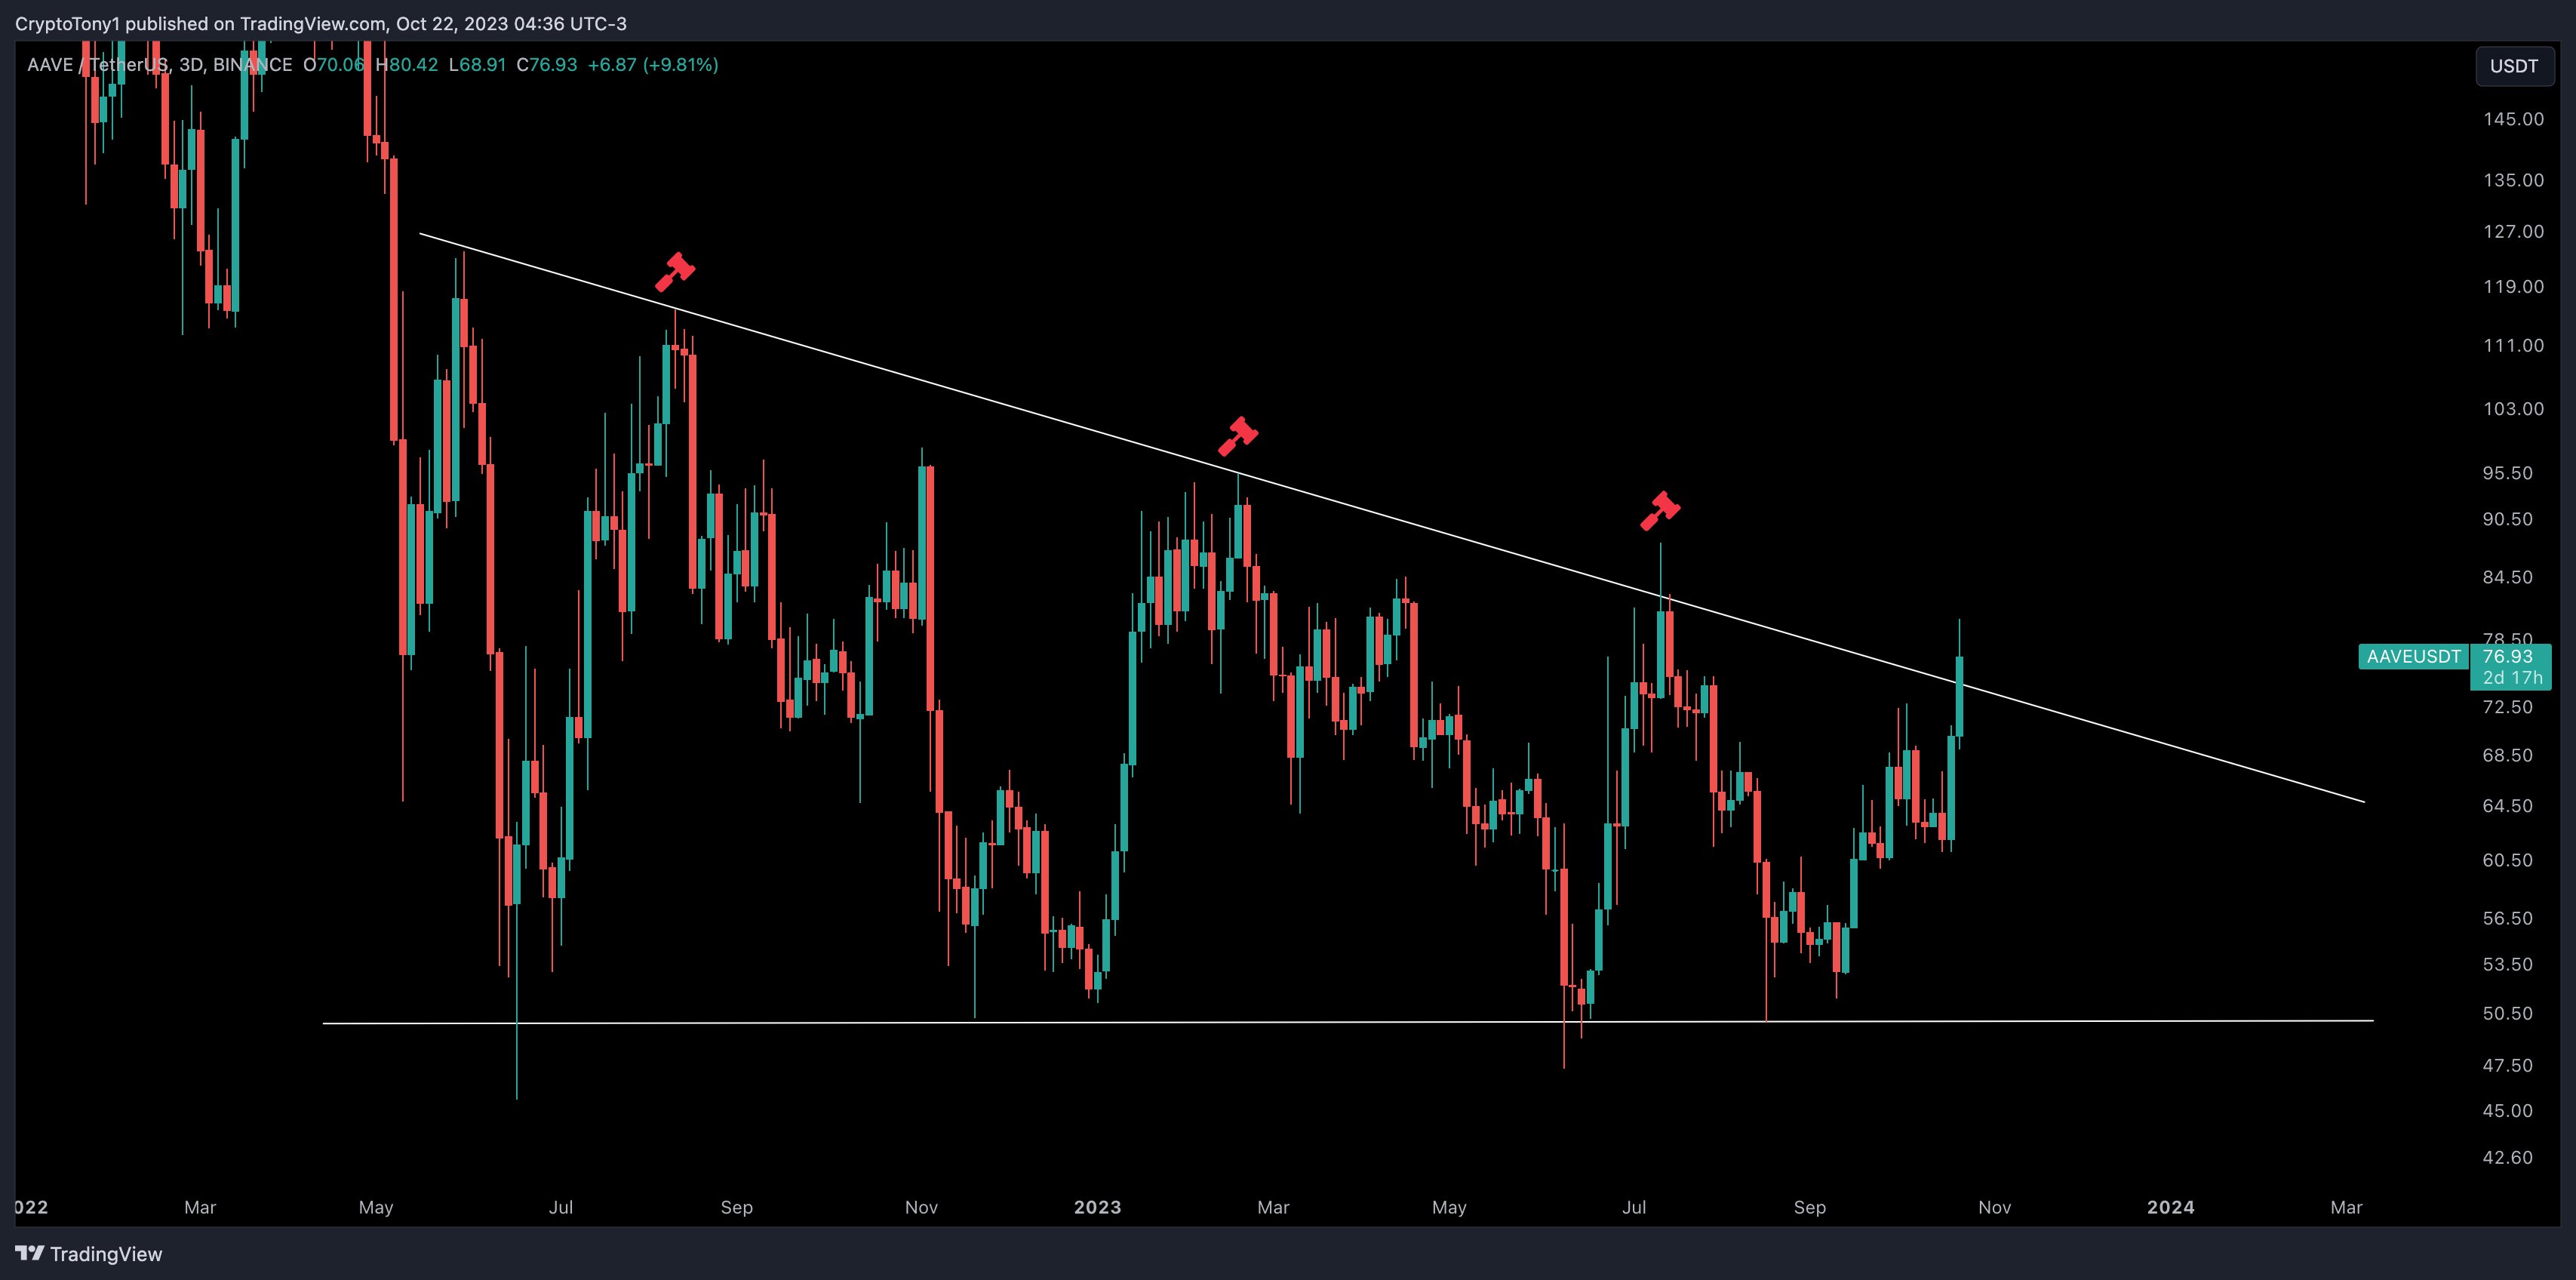
The liquidity protocol experienced a 6% increase in the price of its native token during the same period. CoinGecko data notes a 26% price hike in the past seven days, indicating that AAVE has possibly entered a rally phase and is currently testing new support levels. Crypto trader known as Crypto Tony on X, highlighted the importance of a three-day closure above $75.00 for the bullish sentiment to persist. The trader said, "This would also be the first time we [AAVE] closed above the trend line resistance in 500 days."
At the time of writing, the price of Aave (AAVE) stands at $83 with volume on the daily time frame at $268.5 million.
AAVE RSI suggests trend reversal
The Relative Strength Index (RSI) for AAVE, a momentum indicator that measures the speed and change of price movements, suggests a potential trend reversal as it hovers in the overbought range based on CryptoQuant data. This comes as the exchange reserves have also been on the rise, indicating higher selling pressure.
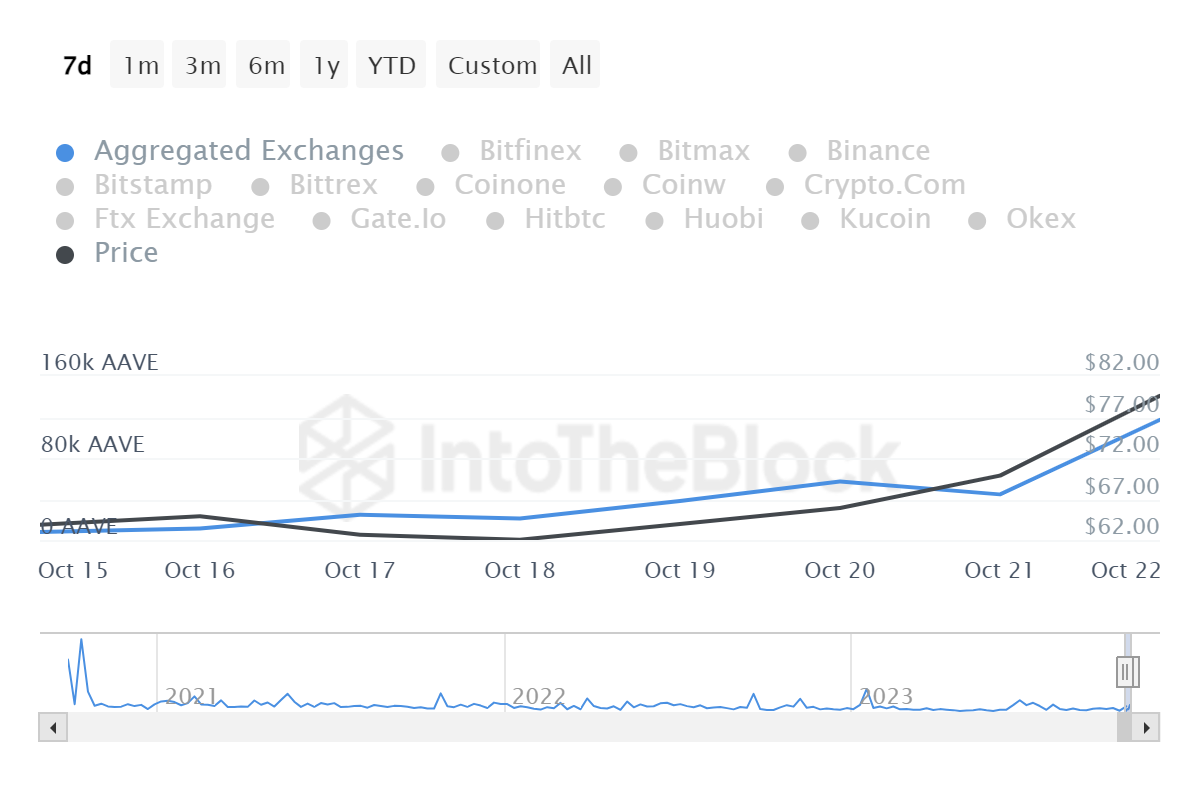
IntoTheBlock's volume indicator notes a seven-day exchange inflow of $21 million against outflows of $15 million. Net deposits on exchanges are currently lower than the 7-day average, which can be interpreted as a sign of reduced selling pressure.
In the short term, AAVE appears to be on a bullish trajectory with recent price surges and increased trading volume in the derivative market. However, its sustainability may hinge on AAVE's ability to overcome selling pressure. AAVE's RSI also suggests a trend reversal, but the selling pressure might remain limited.
Author

Shraddha Sharma
FXStreet
With an educational background in Investment Banking and Finance, Shraddha has about four years of experience as a financial journalist, covering business, markets, and cryptocurrencies.


