AAVE Price Forecast: Aave bears could kickstart a 17% crash
- AAVE price formed a local top of $73.40 on October 1 and has kickstarted a downtrend since then.
- Bears have an opportunity to short the altcoin on the retest of the pullback resistance at $64.50.
- The resulting downtrend could send AAVE down by 17% to revisit the September 11 swing low of $51.39.
- Invalidation of the bearish thesis will occur if AAVE produces a higher high above $67.17.

AAVE price shows a potential start to the downtrend that could extend to lows last seen in early September. Investors need to be careful of steep corrections as bears take control of the altcoin, hinting at volatile moves ahead.
AAVE price ready to slide lower
AAVE price rallied nearly 40% between September 11 and October 1. This uptrend has ended as the altcoin produced two lower lows and lower highs in the last two weeks. As Aave bulls lose control, bears are likely to knock the altcoin to the ground.
As more investors book profits, AAVE price is likely to revisit the first key support level at $57.40 after an 8% crash. A failure from bulls to take control here will extend the downtrend and send it to the critical support levels at $54.10 and $51.39.
In total, a revisit of the $51.39 barrier would denote a 17% downtrend, putting AAVE price to trade at the September 11 swing lows.
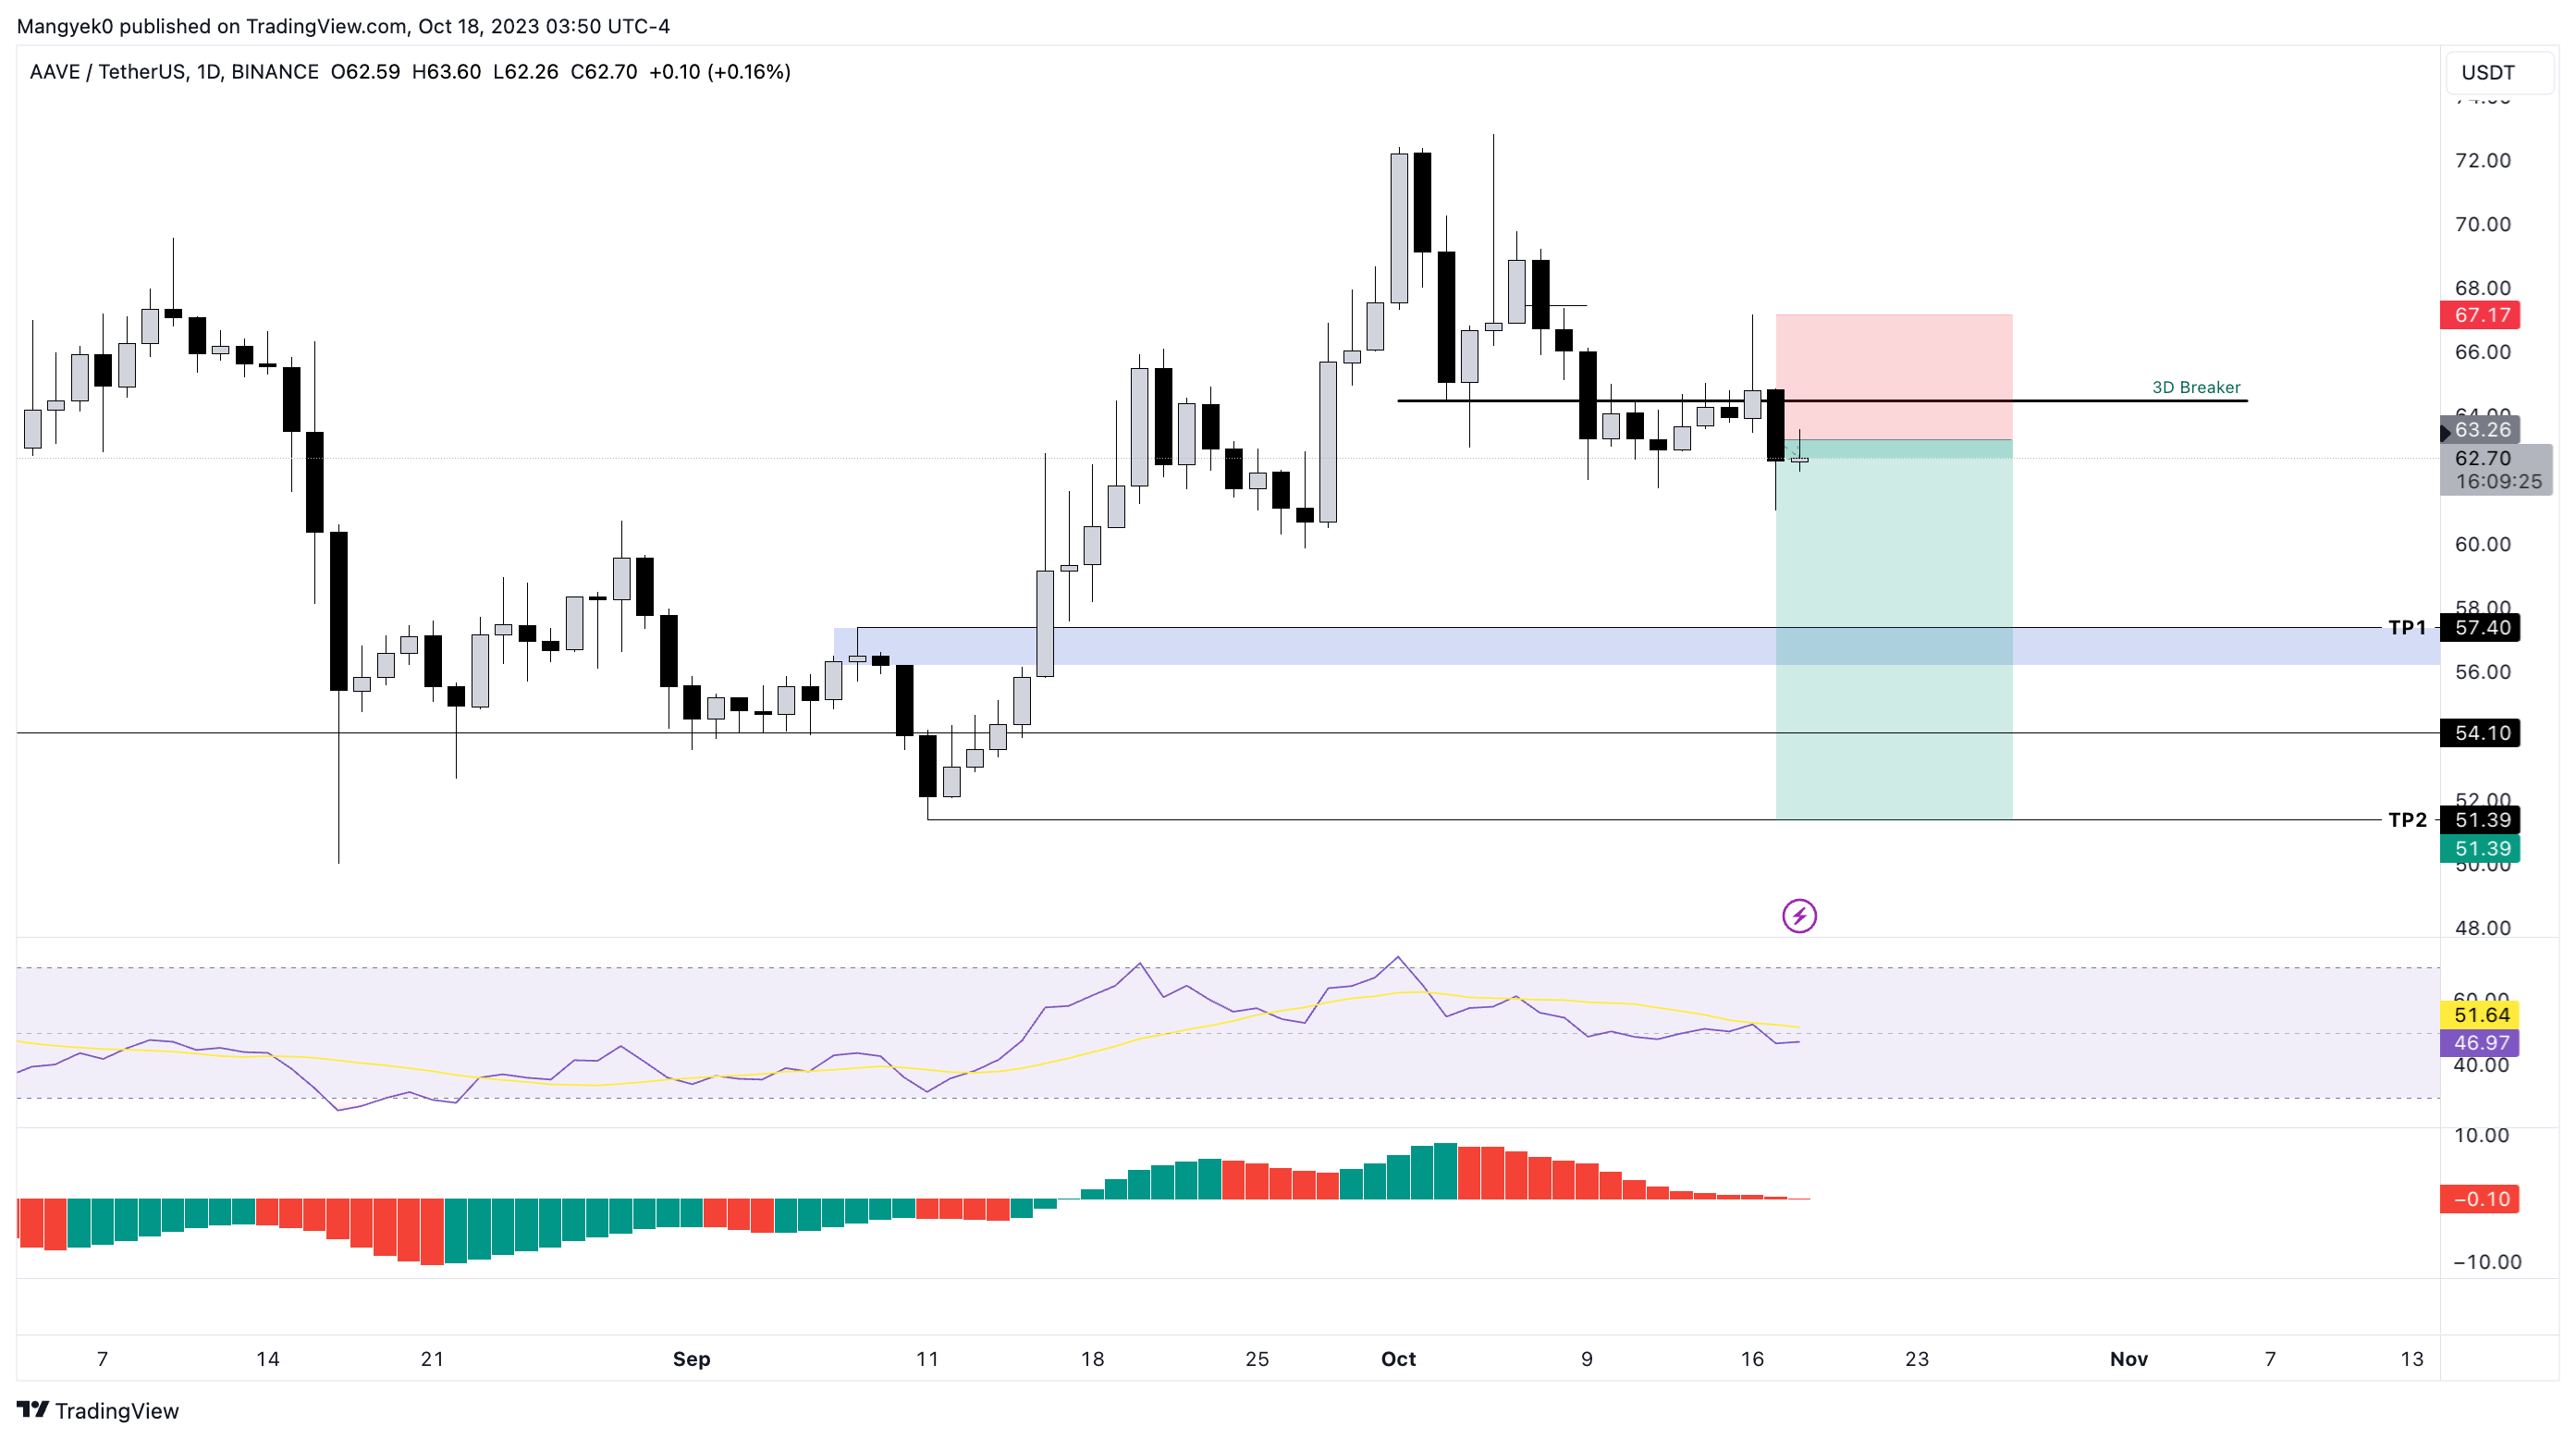
AAVE/USDT 1-day chart
On the other hand, if AAVE price produces a daily candlestick close above the October 16 swing high of $67.17, it would create a higher high. This move would invalidate the bearish thesis and potentially retrigger the uptrend.
In such a case, AAVE price could revisit the October 6 swing high of $69.77.
Author

Akash Girimath
FXStreet
Akash Girimath is a Mechanical Engineer interested in the chaos of the financial markets. Trying to make sense of this convoluted yet fascinating space, he switched his engineering job to become a crypto reporter and analyst.


