1inch Network Price Forecast: Technical outlook suggest a rally ahead
- 1inch price broke and found support around its descending trendline, suggesting a possible rally ahead.
- Sideline investors looking for buying opportunities can accumulate between the $0.261 and $0.273 range.
- A daily candlestick close below $0.250 would invalidate the bullish thesis.
1inch (1INCH) price is retesting key support levels on Tuesday after breaking above a descending trendline on Sunday. Technical outlooks suggest a rally ahead and provide a potential buying opportunity for sideline investors in the $0.261 to $0.273 range.
1INCH price could rally after finding support around key levels
The 1inch price broke and closed above the descending trendline (drawn by joining multiple high levels from mid-March) on Sunday and rallied 7% that day. However, on Monday, it erased the gains registered on Sunday and found support around its previous broken trendline. This trendline breakout level at $0.273 roughly coincides with the 50-day Exponential Moving Average (EMA) at $0.271, making this a key reversal zone. At the time of writing on Tuesday, it trades slightly above around $0.279.
Sideline investors looking for buying opportunities can do so between the $0.261 and $0.273 support levels. Suppose 1inch finds support and bounces off the $0.271 level; it could rally 18% to retest its daily resistance level at $0.322.
The Relative Strength Index (RSI) on the daily chart trades at 54, above its neutral level, indicating a lean towards the upside.
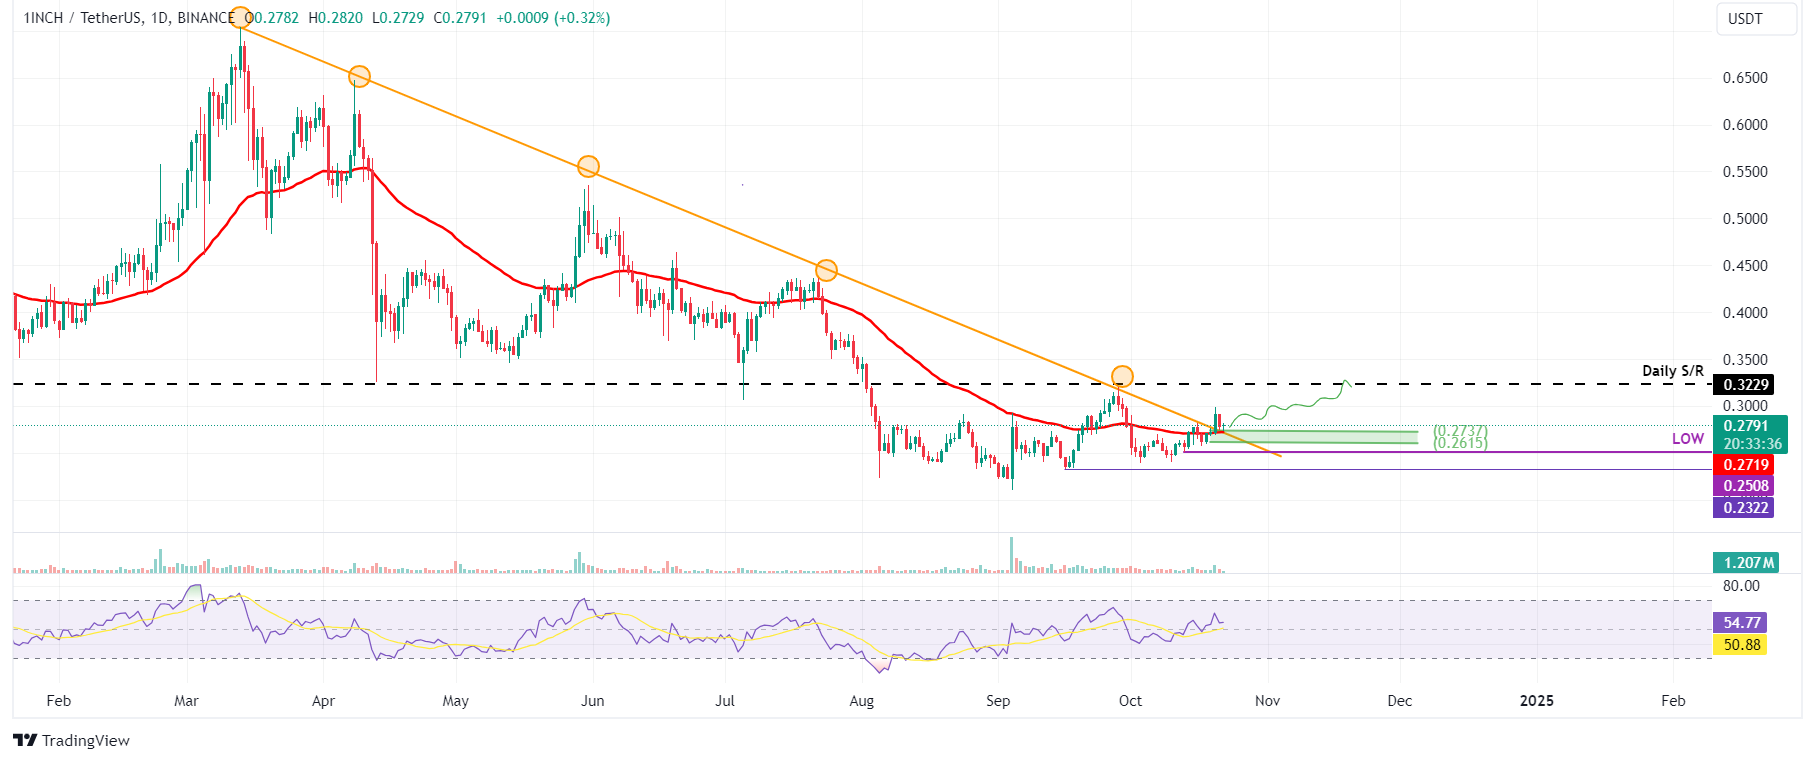
1INCH/USDT daily chart
Based on IntoTheBlock's In/Out of the Money Around Price (IOMAP), nearly 1,110 addresses accumulated 97.95 million 1INCH tokens at an average price of $0.273. These addresses bought tokens between $0.266 and $0.273, which makes it a key support zone.
Interestingly, the zone mentioned from a technical analysis perspective, the $0.273 level, coincides with the IOMAP findings, making this zone a key reversal area to watch.
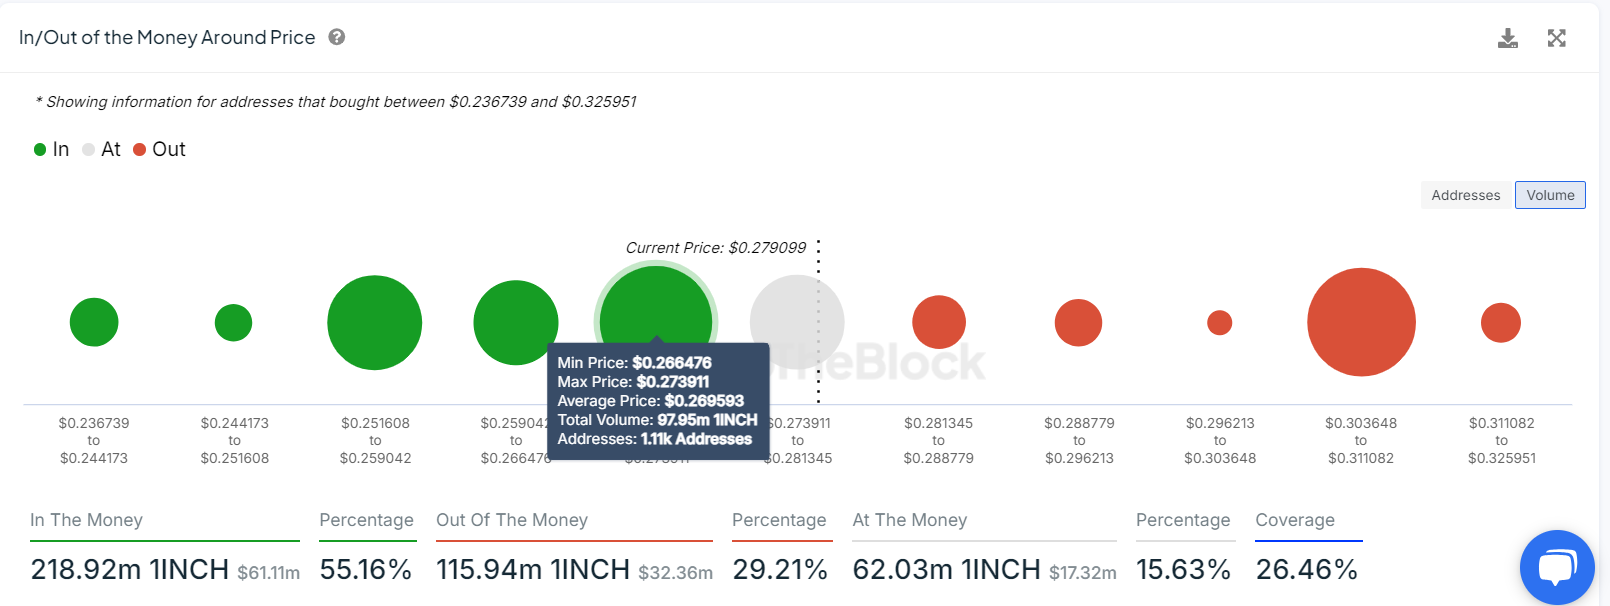
1INCH IOMAP chart. Source: IntoTheBlock
However, the bullish thesis would be invalidated if the 1inch price closes below $0.250. This scenario could lead to a further decline in 1inch price to retest its September 16 low of $0.232.
Cryptocurrency prices FAQs
Token launches influence demand and adoption among market participants. Listings on crypto exchanges deepen the liquidity for an asset and add new participants to an asset’s network. This is typically bullish for a digital asset.
A hack is an event in which an attacker captures a large volume of the asset from a DeFi bridge or hot wallet of an exchange or any other crypto platform via exploits, bugs or other methods. The exploiter then transfers these tokens out of the exchange platforms to ultimately sell or swap the assets for other cryptocurrencies or stablecoins. Such events often involve an en masse panic triggering a sell-off in the affected assets.
Macroeconomic events like the US Federal Reserve’s decision on interest rates influence crypto assets mainly through the direct impact they have on the US Dollar. An increase in interest rate typically negatively influences Bitcoin and altcoin prices, and vice versa. If the US Dollar index declines, risk assets and associated leverage for trading gets cheaper, in turn driving crypto prices higher.
Halvings are typically considered bullish events as they slash the block reward in half for miners, constricting the supply of the asset. At consistent demand if the supply reduces, the asset’s price climbs.
Author

Manish Chhetri
FXStreet
Manish Chhetri is a crypto specialist with over four years of experience in the cryptocurrency industry.


