Yen and Swissy in demand as forex traders opt for safety
Market Overview
Market sentiment has taken a step back as traders are looking more towards safe haven plays such as the yen and Swissy in the forex space. With geopolitics coming back to the forefront, markets are becoming more sensitive to newsflow once more. Donald Trump has tended to have less of an impact recently, but he seems to be an increasing factor for market sentiment an direction again. Even though US Treasury Secretary Steve Mnuchin said that “very meaningful progress” had been made, Trump noted that he was “not satisfied” over the start of the trade negotiations with China. However, Trump also said that there is a “substantial chance” of the summit between US and North Korea (scheduled for 12th June) not taking place. There still seem to be differences over the definition of the word “denuclearisation”. President Trump will be keen to roll back expectations should he feel that there is a prospect of him losing face in the PR driven Twittersphere. The subsequent market reaction has been to pull back on risk appetite. It is interesting to see the dollar performing better against higher risk currencies, whilst safe haven plays are much more in demand. With Treasury yields dropping back, the safe haven yen and Swiss franc are performing better. Equities have also gone into retreat for now. Looking forward today there is a packed calendar and this is likely to be a day with elevated volatility as a result.

On Wall Street there was a slip back last night with the S&P 500 -0.3% at 2724, and with futures looking weaker still this morning we have seen Asian markets also lower (Nikkei -1.2%). European markets are showing similar caution today in early moves. In forex, the dollar is performing well, but the standout performers are the yen and the Swiss franc with an appetite for safety clearly back in the market. In commodities there is a consolidation continuing on gold, where the impact of dollar strength is countered by a safe haven appetite. The recent run higher on oil is taking a slight pause as WTI and Brent both drop back by just under half a percent.
Today is the big day for economic announcements this week, and traders will be facing several major releases that will drive sentiment. We start with the Eurozone flash PMIs at 0900BST. Can the negative momentum of the recent data deterioration begin to turn around? Eurozone Flash Manufacturing PMI is expected to tick only slightly lower to 56.1 (from 56.2), whilst Eurozone Flash Services PMI is expected to be steady at 54.7 (54.7 last month), with the Composite PMI at 55.0. UK inflation at 0930BST will be key for sterling, with the headline CPI expected to be steady at +2.5% (+2.5% last month) whilst the core CPI is expected to slip marginally to +2.2% (from +2.3%). Watch also for the PPI Input Prices which are expected to jump higher by +5.8% (up from +4.2% last month) which would be a signal that sterling weakness is still a factor in imported inflation. US Flash PMIs are at 1445BST with Flash Manufacturing PMI expected to be steady at 56.5 (56.5 last month) whilst Flash Services PMI are expected to improve marginally to 54.9 (54.6 last month). The EIA oil inventories are at 1530BST and are expected to again show a series of inventory drawdowns with crude stocks expected to be in drawdown by -3.0m (-1.4m barrels last week), distillates in drawdown by -1.0m barrels (-0.1m last week) and gasoline at -1.8m barrels (-3.8m last week). Finally the FOMC minutes for the May meeting are at 1900BST which will be poured over for suggestions that building inflation is pushing the committee towards a more hawkish positioning on the path of rate hikes.
Chart of the Day – USD/CHF
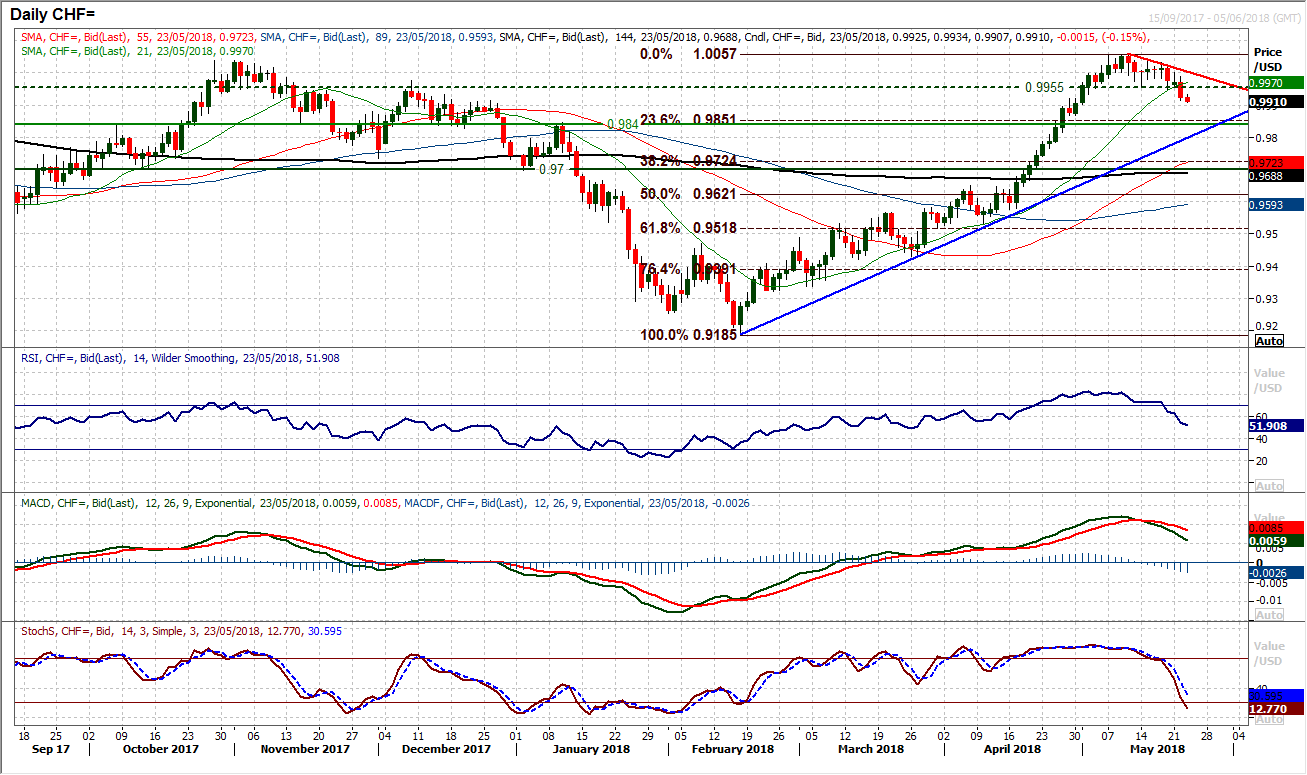
We highlighted last week the fact that the Swiss franc was beginning to strengthen and pull a reversal on Dollar/Swiss. The pair is now building on this move having broken down to a new three week low yesterday and continues to retrace the huge February to May bull run from 0.9185/1.0057. Since the acceleration higher has moved into reverse in the past couple of weeks the market has suddenly looked to form lower highs and lower lows with a mini downtrend that comes in at 1.0000 (parity) today. It is interesting to see that the market formed a decisive bear candle yesterday with the first decisive close below the support of the rising 21 day moving average since the early days of the recovery back in February. Momentum indicators confirm the corrective outlook, with the RSI & Stochastics dropping sharply, the MACD lines having posted a bear cross. The first real support is at 0.9840 which is a long term pivot level coincides with the 23.6% Fibonacci retracement at 0.9850. There is now a band of resistance with the near term breakdown at 0.9955 and yesterday’s traded high at 0.9900. The hourly chart shows how intraday rallies are now being sold into. And any unwinding move towards 50/60 on the hourly RSI is a chance to sell.
EUR/USD
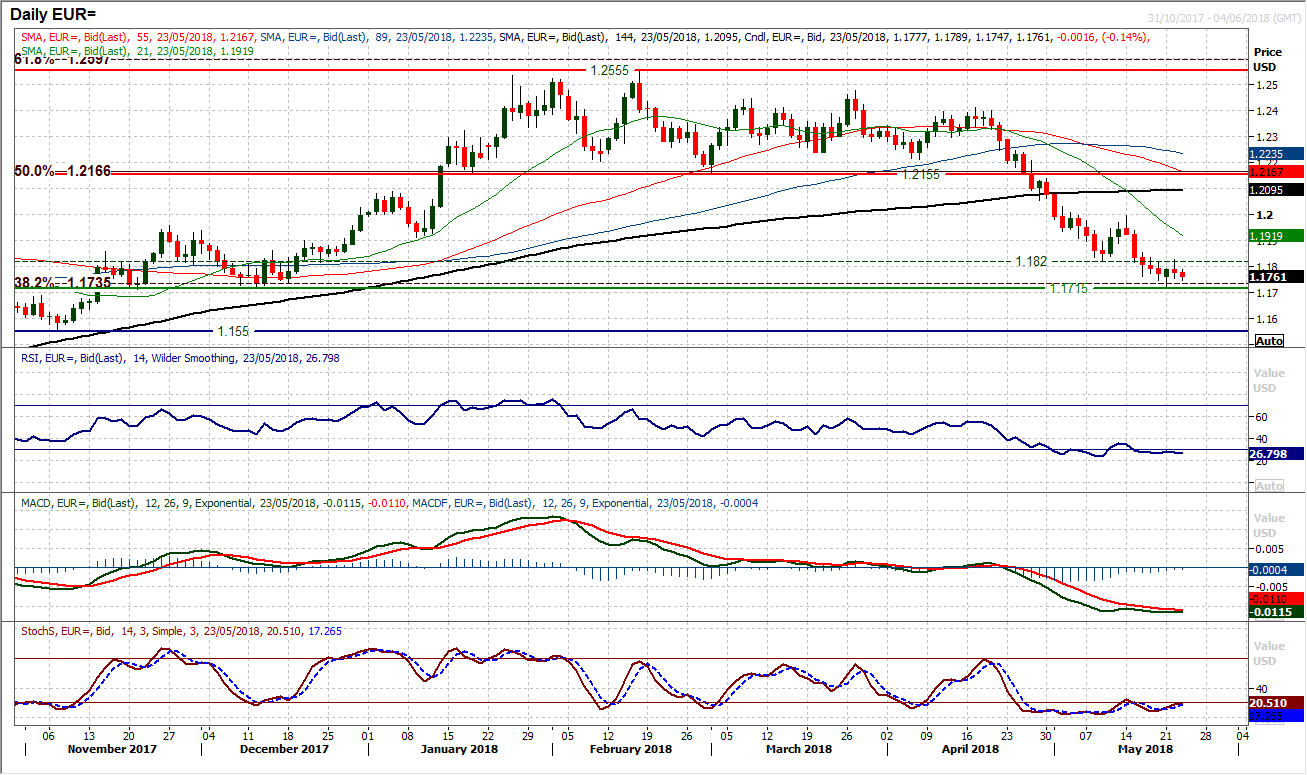
The positive impact of Monday’s rebound candle could not be sustained yesterday as the euro struggled to overcome its previous support which is now resistance around $1.1820. The subsequent formation of a mildly negative candle which has continued lower into today’s session leaves the possibility open for a retest of the near term key support at $1.1715 once more. Rallies on EUR/USD continue to be sold into and although the risk remains to the downside, all is not yet lost in this potential recovery. The reaction of the European traders this morning and into the afternoon could be key to the near term outlook. With a raft of data releases, volatility will be elevated throughout this session. The bulls will have to fight hard to hold on to $1.1715, whilst $1.1820 is a key pivot area resistance now. How the market reacts to these two levels will determine the near term direction. The balance of indicators remains negative on both daily and hourly charts.
GBP/USD
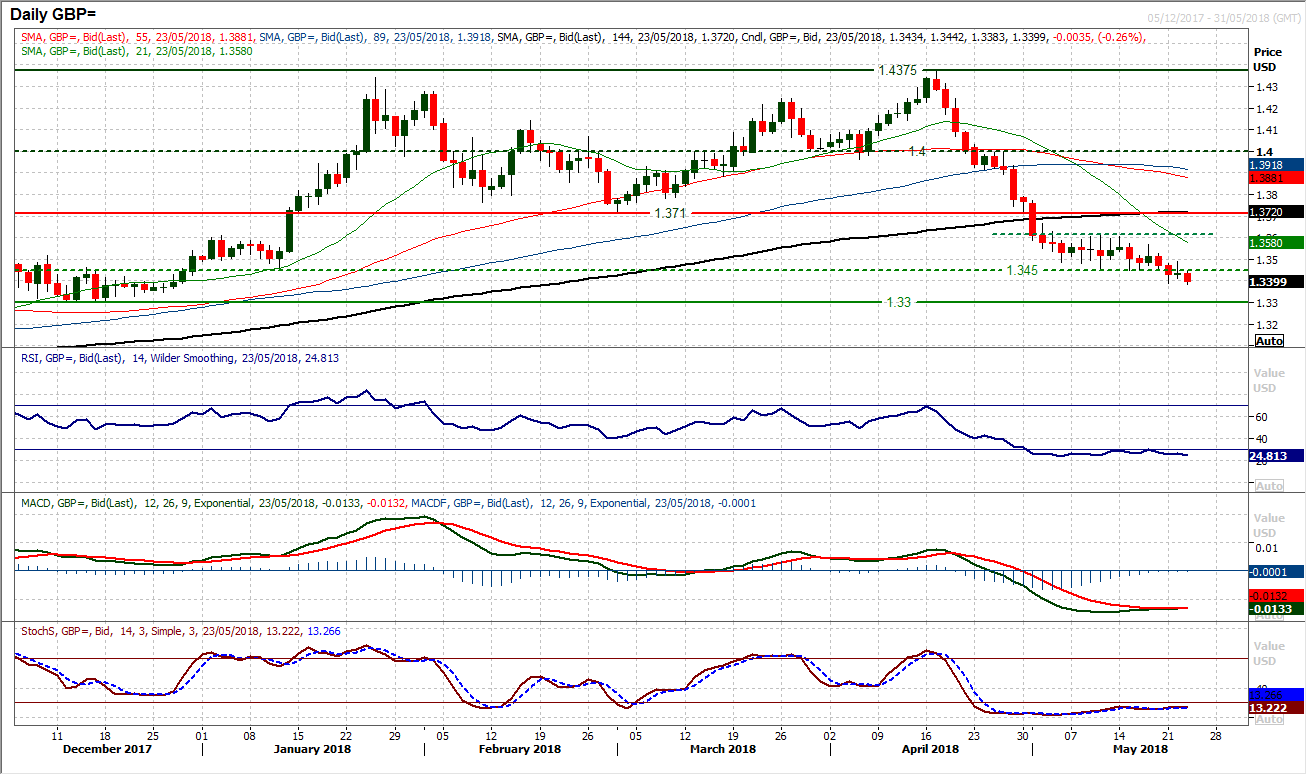
The potential recovery on Cable did not seem to last all that long as the market sold back into the close to leave a doji candle on the session. Closing back under the old support at $1.3450 (which is now a near term area of overhead supply) and being followed up by early downside today, the recovery prospects do not look promising. Momentum indicators may have plateaued but they remain negatively configured and all suggest that selling into strength remain the strategy. Yesterday’s lower high at $1.3490 now becomes a level of resistance to watch under $1.3570 and the key resistance at $1.3615. The hourly chart shows attempts at pulling a more positive configuration on momentum seem to have been denied and the $1.3390 support is very close. The range break below $1.3450 implied $1.3300 and with the recovery quickly scuppered, there is little to suggest this will not be seen.
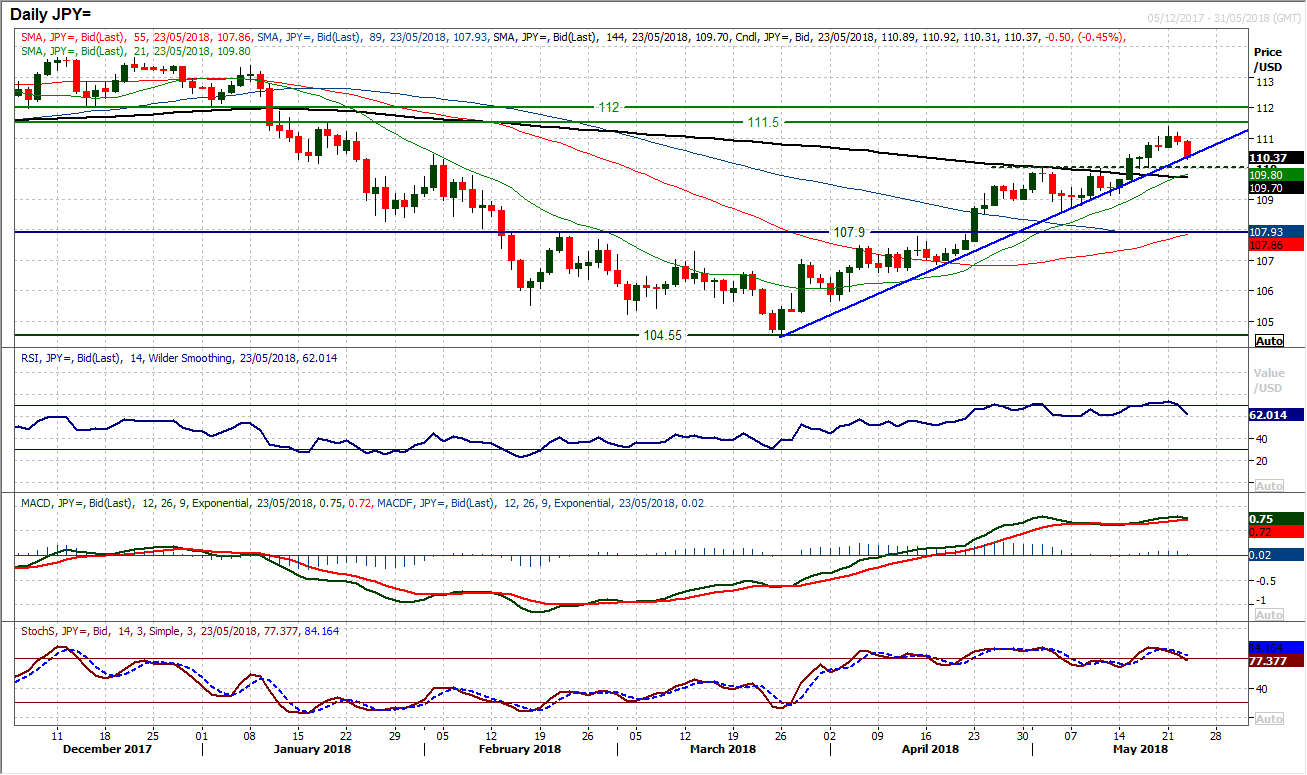
USD/JPY
The eight week uptrend is again being tested. This sort of situation has been seen on several occasions during the run higher, but an early move lower has today has now seen the market drop back around 100 pips from the recent high of 111.40 right back to the uptrend which comes in around 110.40 today. Old breakouts are supportive and there is a run of higher lows in place that means underlying demand is in place to help bolster support. The first reaction low is at 110.00 and it will be interesting to see how strong this uptrend proves to be now. Momentum indicators have taken note of the 100 pip decline and have started to tick lower, but unless the RSI drops decisively below 60 and Stochastics decline below 70 then this will remain a correction within the run higher. The hourly chart shows how this is an important test for the bulls now, with hourly momentum indicators creaking and threatening to turn more corrective. There is now a band of near term resistance between 110.80/111.20. Below 111.00 is the old key breakout support at 110.47.
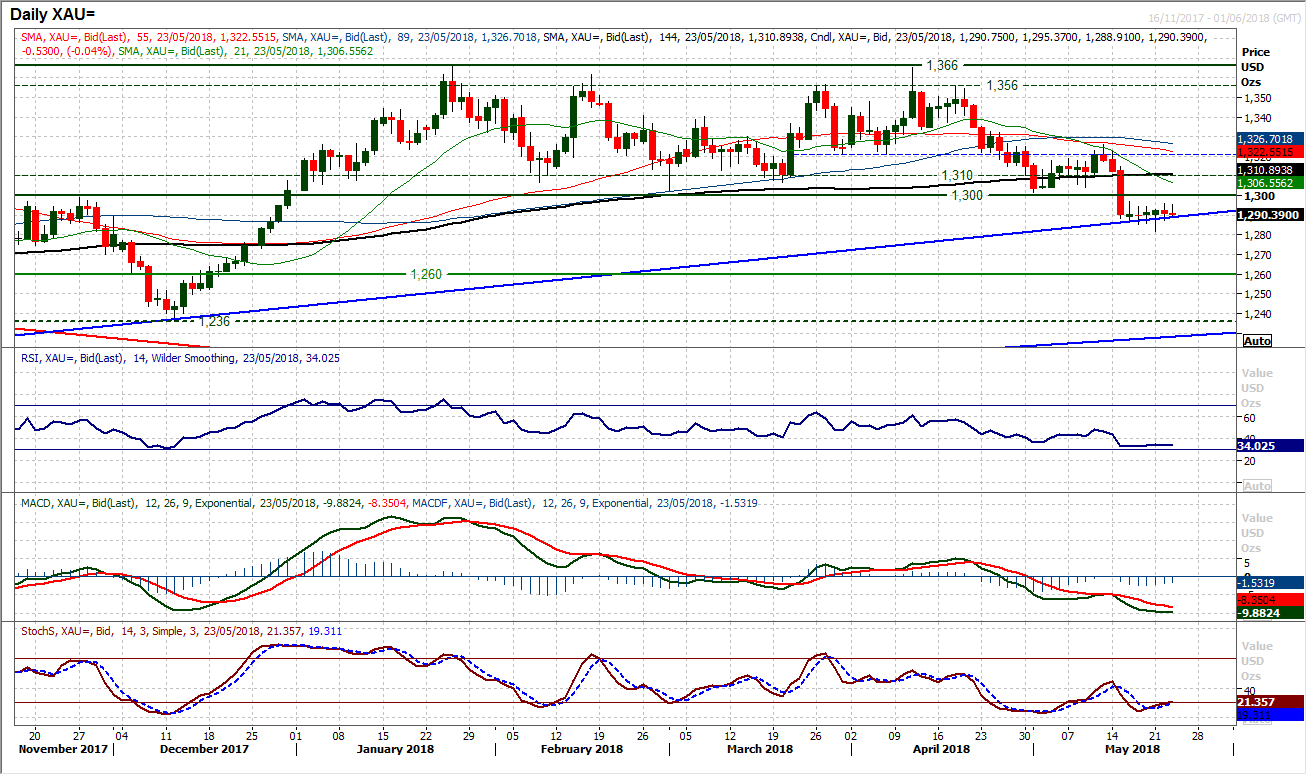
Gold
In recent days the gold chart has been littered with a series of false moves. The chart is on a run of now five completed candles of small real bodies and often long upper or lower shadows. This suggests an uncertainty over direction with the market being pulled one way and then the other, but with no overall control. This is all playing out under the long term pivot band $1300/$1310 which is now a basis of overhead supply. Momentum indicators on the daily chart have settled down following the sharp negative break below $1300, but they continue to be bearishly configured. This battle for control is reflected on the hourly chart where the moving averages have all converged and are flattening, whilst hourly momentum indicators are increasingly benign. Support at $1287.40 now protects the recent low at $1281.80, whilst resistance around $1296/$1297 grows.
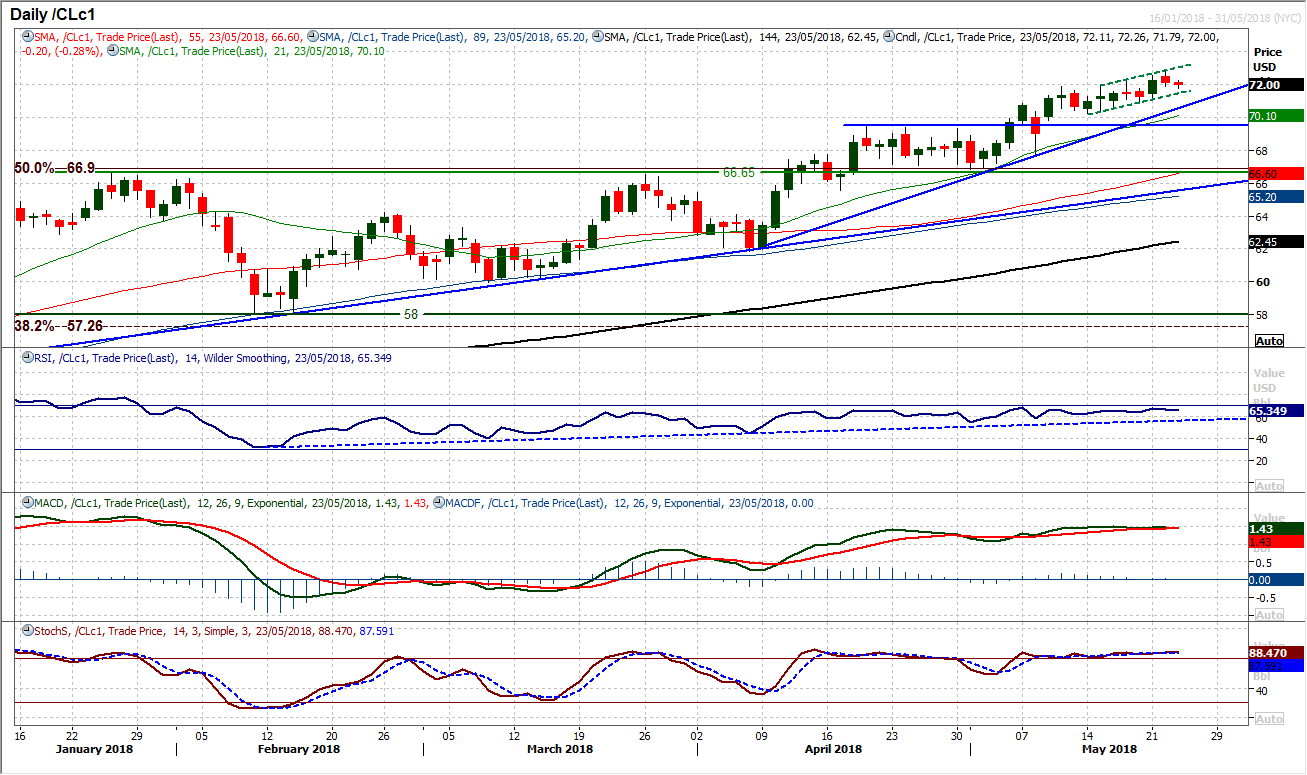
WTI Oil
The bulls continue to push on in the drift higher into multi-year highs, with intraday weakness still an opportunity to buy. Yesterday’s move hit $72.85 before slipping back into the close, but as yet there is little to suggest that this move will be seen as anything more than another chance to buy. Momentum indicators remain bullishly configured and intraday weakness is consistently being bought into. The RSI is in the mid-60s still and anything holding above 60 will continue to be positive momentum for a continued trend higher. The current six week uptrend is supportive at $70.30 whilst there is price support in the band $71.00/$71.90 initially. The hourly chart shows a slight caveat with the hourly RSI dropping bacl below 40 and the MACD lines below neutral. This suggests the bulls may have to respond today. A decisive move below $71.00 would begin to ask a few more questions.
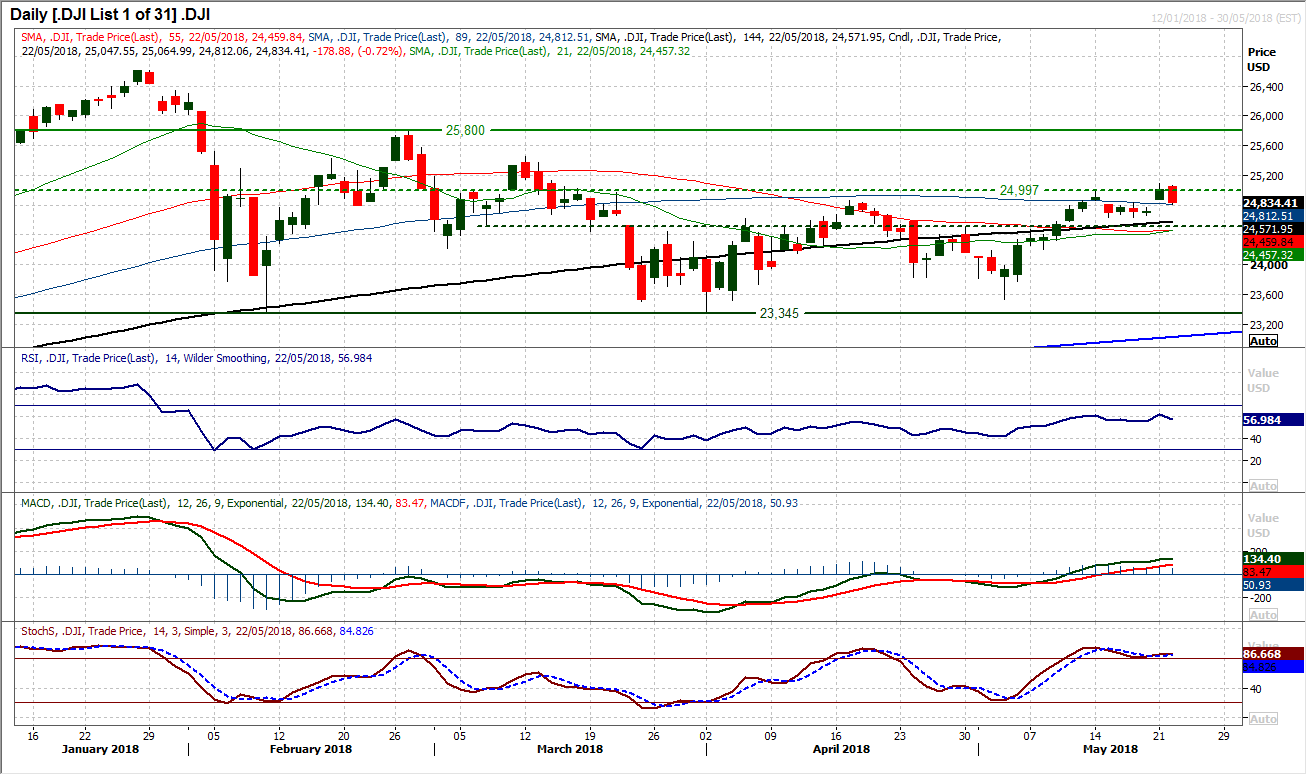
Dow Jones Industrial Average
The bulls may have previously broken through to a two month high above 25,000 but the move was not seemingly via a breakaway gap as the market corrected back yesterday with a solidly negative session that was the most corrective candle in almost three weeks. Despite this though the confirmation of multi-month highs on RSI and MACD lines suggest that there is backing for a move higher still. Trading above the moving averages also adds to the bull bias now. Yesterday’s slip to close lower may now fill the gap at 24,775 but is still likely to be seen as a chance to buy. The hourly chart shows any unwind towards 40 on the hourly RSI or neutral on the MACD lines is a chance to buy. The bias is still for renewed buying and a quick retest of resistance at 25,086 whilst the bulls will be looking higher at 25,449 and ultimately the 25,800 key February high.
Author

Richard Perry
Independent Analyst


