Will Fed easing support risk assets?
Summary
With the Fed signaling openness to lowering rates following its June meeting, US Strategist Mona Mahajan explores what an easing cycle could mean for risk assets. Data from the past eight Fed ratecutting cycles – from 1981 to 2007 – suggest that where we are in the US economic cycle may dictate how risk assets respond to the next round of Fed easing.
Key takeaways
-
We believe the Federal Reserve is likely to commence an easing cycle in the second half of 2019; the FOMC has indicated that its next move will be a rate cut.
-
While US growth is decelerating, we do not see an imminent recession over the next six months; thus, Fed easing would be what we classify as an "insurance" cycle.
-
Historically, equities and fixed income performed well during insurance cycles; the S&P 500 generated a 20.4% average return one year after the start of an insurance easing cycle.
-
While insurance easing cycles historically have resulted in positive returns, we continue to favor defensive and up-in-quality positioning across risk markets, particularly after strong first-half returns.
The Fed's next move will be policy easing
At the FOMC's meeting in June, Jerome Powell and team delivered a dovish message that exceeded market expectations, signaling the Fed is ready and willing to step in with policy easing "as appropriate." Several updates to its statement, economic projections and press conference suggest the Fed's next move will be a rate cut.
In particular:
-
The FOMC statement saw the removal of the "patient" language, while economic activity was recategorized as "moderate" and uncertainties about the global outlook "increased."
-
The FOMC's updated median "dot plot" showed a rate cut for 2020 instead of a rate hike it showed at the last meeting (Exhibit 1). Notably, seven of the 17 FOMC members projected 50 basis points of easing this year.
-
Powell indicated clearly in the press conference that he "will act as appropriate" in terms of the Fed's rate path, noting "many participants now see the case for somewhat more accommodative policy."
Our base case now calls for a 25 basis point rate cut in both September and December. We believe a Fed easing cycle is likely to commence in the second half of 2019. We could potentially see a rate cut as early as July – despite a solid jobs report this month – if the Fed chooses to undertake insurance cuts (see below for detail), particularly in light of rising levels of negative-yielding debt globally and the ongoing inversion of the US yield curve. Additionally, while we see the Fed most likely moving in 25 basis point increments, a 50 basis point rate cut this cycle is not out of the question, depending on whether data deteriorate swiftly.
Exhibit 1: Fed dot plot vs. market expectation
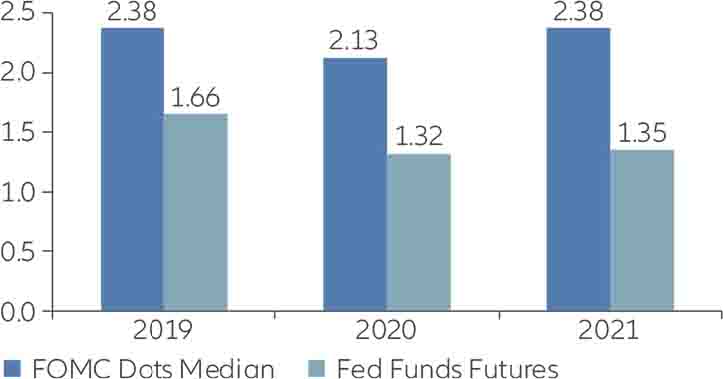
Source: Bloomberg, July 2019
Not all easing cycles are created equal: "insurance" vs. "pre-recession" easing
What would a Fed easing cycle mean for risk assets broadly? We observed data around the past eight Fed rate-cutting cycles – from 1981 to 2007– and highlight several key takeaways.
Two types of Fed easing cycles
We categorize Fed easing cycles into two broad groups: insurance cycles or pre-recession cycles. Insurance cycles are when the Fed eases while the economy is not in a recession, but economic headwinds loom. Pre-recession cycles are when the Fed eases as the economy is entering or already in a recession. Of the last eight easing cycles since 1981, the split between insurance and pre-recession cycles was even, with four in each camp (Exhibit 2).
Exhibit 2: Insurance and pre-recession Fed easing cycles since 1981
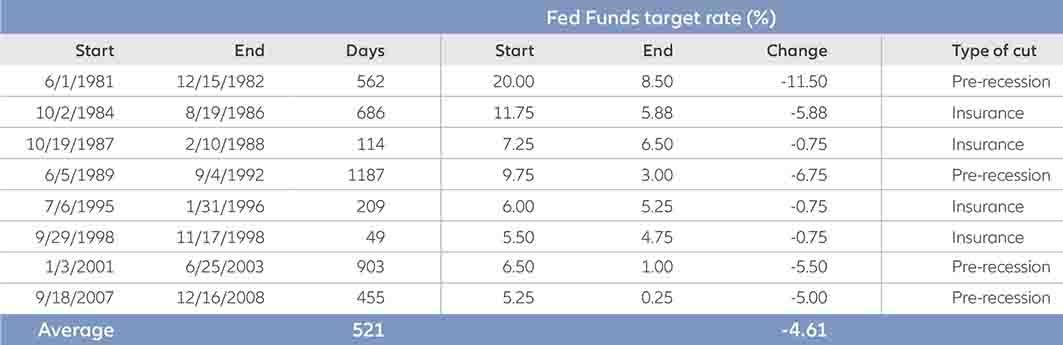
Source: Allianz Global Investors Global Economics & Strategy, June 2019
Risk returns in insurance vs. pre-recession cycles
Historically, market performance during an insurance pre-recession cycle varied significantly. One year into an easing cycle, the S&P 500 generated a 20.4% average return during insurance cycles and a -10.2% average return during pre-recession cycles (Exhibit 3). This divergence suggests that where we are in the US economic cycle may dictate how risk assets respond to the next round of Fed easing.
Exhibit 3: S&P 500 performance one year before and after initial rate cut

Source: Factset, June 2019. Past performance is no guarantee of future results. It is not possible to invest directly in an index.
Diverging returns between easing cycles lies primarily in equities: the US, global and emerging market equities all performed substantially better in insurance cycles than in pre-recession cycles (Exhibit 4).
Exhibit 4: Excess return vs. cash during Fed rate cut cycles
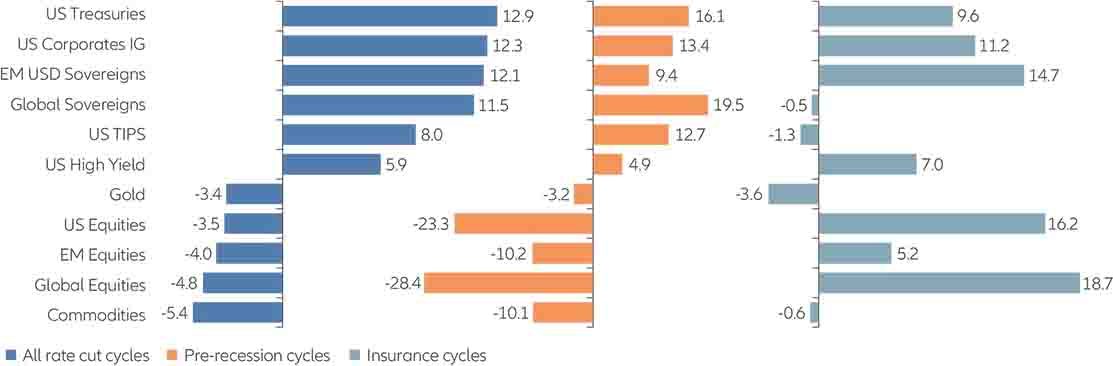
Source: Allianz Global Investors Global Economics & Strategy, Bloomberg, Datastream, June 2019
Certain asset classes performed similarly regardless of cycle type. Fixed income assets generally performed well in both insurance and pre-recession cycles, while real assets, such as gold and commodities, tended to underperform regardless of the cycle type.
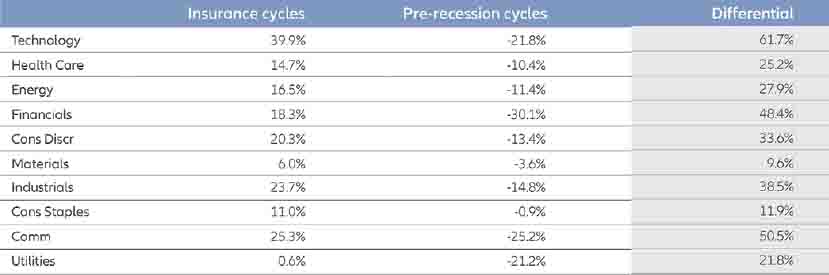
From a sector perspective, we find that cyclical sectors – such as technology, industrials and consumer discretionary – tend to perform well in insurance cycles, while more defensive areas like healthcare and consumer staples lag. The reverse is generally true during pre-recession easing cycles: cyclical sectors tend to underperform, although we also see more defensive sectors like utilities lag materially (Exhibit 5).
Exhibit 5: S&P 500 GICS sector performance one year after initial rate cut
Source: Factset, June 2019. Past performance is no guarantee of future results. It is not possible to invest directly in an index.
An "insurance" Fed easing cycle could be likely this time
The US economy – alongside the global economy – is certainly decelerating, but growth isn't expected to turn negative. While we believe the fragility in the economy has increased, and tail risks from areas like trade and geopolitics remain consistent overhangs, we do not yet see an imminent recession risk over the next six months, when the Fed is expected to begin its easing cycle.
Real growth forecasts in the US are expected to slow – from 3% in 2018 to the low 2%-range this year, and to below 2% in 2020. Indicators such as manufacturing purchasing managers' indexes (PMIs) and OECD leading indicators are also weakening, while the S&P 500's earnings growth is likely to slow to the low singledigits this year, down from 20% last year.
However, we continue to see one key area of overall strength in the economy: the US consumer – which is critical, considering domestic consumption comprises nearly 70% of US GDP.
Unemployment remains near historic lows at 3.7%, while consumer confidence remains near its multi-year high, despite recent volatility. We have also seen a recent rising trend in consumer spending, particularly among discretionary categories; lower rates may also provide support to critical areas like housing and auto sales.
The recent tariff truce between President Trump and China's President Xi at the last G20 meeting in Japan was incrementally positive, particularly for the US consumer, as both sides agreed to resume trade discussions "on the basis of equality and mutual respect." Importantly, the US also decided to postpone tariffs indefinitely on the final $300 billion of Chinese imports, which mainly targeted consumer goods, such as textiles, apparel and footwear. While global trade tensions continue to remain an overhang, the immediate threat of another round of consumer-focused tariffs is off the table for now.
The 1990s case study: similarities to today
As the Fed likely embarks on rate cuts later this year, we see somewhat similar economic conditions present today that previously resulted in two insurance easing cycles during the 1990s.
In 1995, the Fed trimmed rates as an insurance measure when inflationary pressures eased; inflation (core CPI) fell from 5% the previous year to the 2%–3% range, while unemployment fell from 5.6% to 4.0%. Today, the US economy has a similar inflationary and unemployment profile with core CPI stagnating in the 2% range and unemployment falling to multi-decade lows.
In 1998, the Fed enacted another insurance cut on the economy, reducing rates preemptively to cushion the effects of an external shock – namely the Asian financial crisis – which could have potentially hindered US growth. Today, concerns about worsening US-China trade relations and escalating tariffs could be considered a similar external threat, acting as a potential catalyst for a slowdown; the Fed could respond to these potential shocks with insurance cuts.
Portfolio positioning: remain defensive and up-in-quality
While the Fed may be embarking on the start of an insurance easing cycle, which has historically been favorable for risk assets, it is worth noting that market returns in the first half of the year were remarkably strong, with the S&P 500 up nearly 18%, and are unlikely to be annualized.
Nonetheless, given that insurance easing cycles historically result in positive returns, we believe active exposure is necessary, with a focus on defensive and up-inquality assets across risk markets.
-
We continue to favor a barbell approach in both domestic and global equities. In the US, we like select cyclical sectors that have done well historically in insurance easing cycles, including areas of technology with secular growth themes such as mobile payments, cloud, and cybersecurity. On the other side of the barbell, we favor more defensive sectors like aerospace/defense, REITs and staples, which have all lagged technology this year but tend to perform well in a decelerating growth environment. Globally, we continue to prefer US equities from a developed market perspective and also favor select Asian and emerging market equities internationally.
-
In fixed income, we continue to prefer an "up-in-quality" positioning in both US investment grade and high yield. Given the ongoing "hunt for income" that investors face in today's low-rate environment, we also see select opportunities in European and Asian high yield, especially for US-dollar-denominated investors. In addition, we continue to favor convertible bonds, which also offer the potential for equity upside.
-
We remain overweight alternatives, both liquid and illiquid, which tend to be less correlated to both equities and fixed income, providing an appealing source of diversification. We believe areas like absolute return and long/short strategies, as well as private credit or infrastructure debt and equity, remain favorable at this stage of the cycle.
Author

Clint Sorenson, CFA, CMT
WealthShield


