What is going on with housing?

Headline GDP growth for the second quarter of 2018 was great. It was nice to finally see what appeared to be robust growth in the US economy. As we mentioned last week, US growth finally broke out (nominally) above what we deem as important resistance.
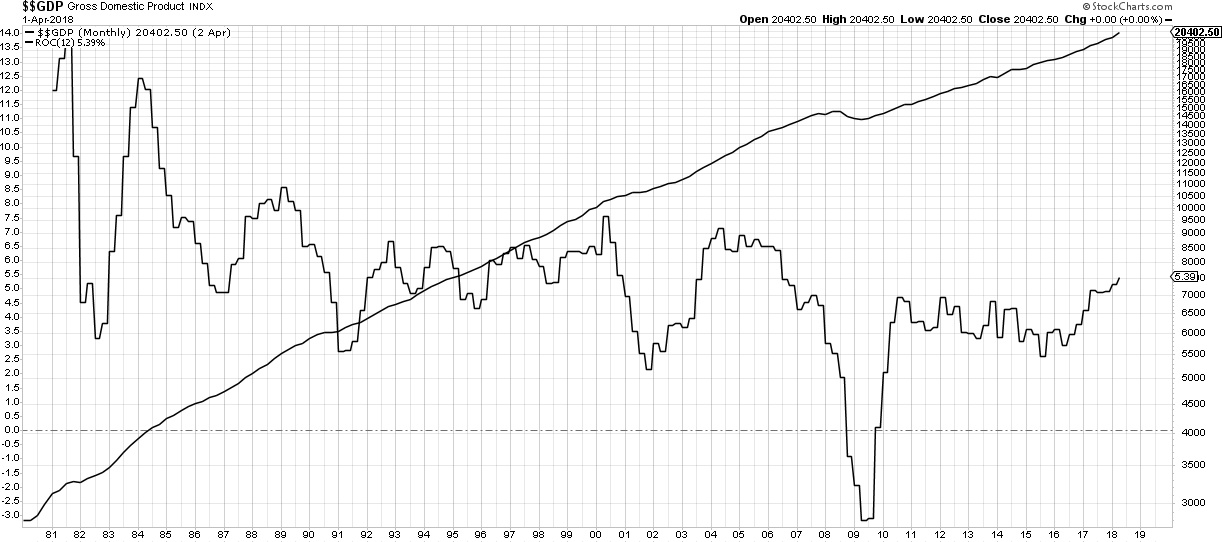
The question we have to ask ourselves now, as investors, is whether the growth we have witnessed recently is sustainable.
In order to dig a little deeper in an attempt to ascertain whether this is the case, we want to take a closer look at the housing market. Why housing? We believe housing trends are a great indicator of the overall strength of the US consumer. So if we can get the housing trend right, then we should be able to get the ultimate trend of the consumer correct. If the consumption is approximately 70 percent of US GDP, then we must pay attention to housing. So now that you all follow the logic, we want to illustrate some concerning trends we are witnessing in housing that have us questioning the sustainability of recent US economic activity...
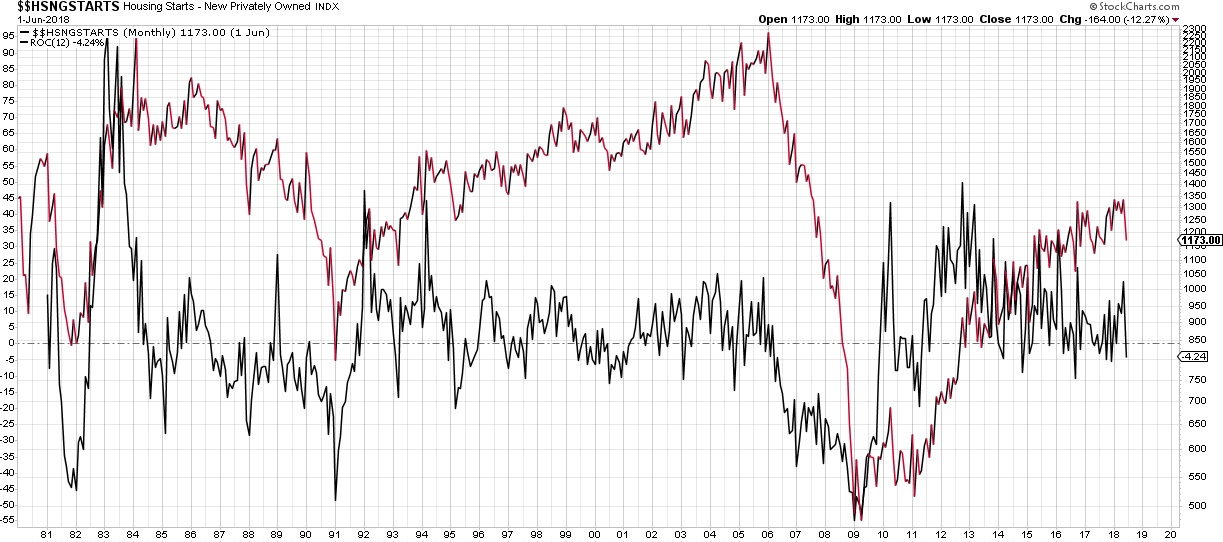
Some concerning trends are present in the Housing Starts breakdown above. Housing starts have now been declining year over year, dropping over 4%. Now, before everyone gets too pessimistic, this time series is extremely volatile. In fact, from a historical standpoint, support tends to reside around -10% on the rate of change line (black). However, the direction of the line is not a good sign. We would like to see this indicator rebound and break to new highs, otherwise, the housing market may have peaked.
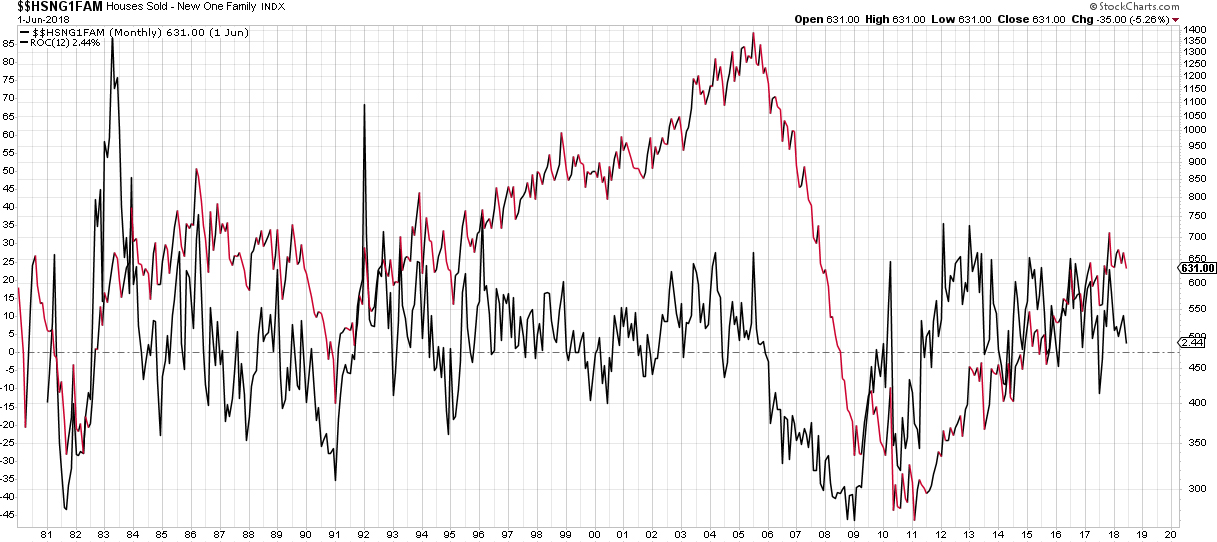
Another indicator of housing market strength and weakness is a measure of single family homes sold. We like this measure because it is a good indication, at least historically, of housing demand. Unfortunately, year over year growth in houses sold has slowed dramatically. Prior to the global financial crisis, new single family homes sold started declining in 2006. It was a good leading indicator of economic weakness to come as a nasty recession hit the US economy in 2008.
Housing Affordability
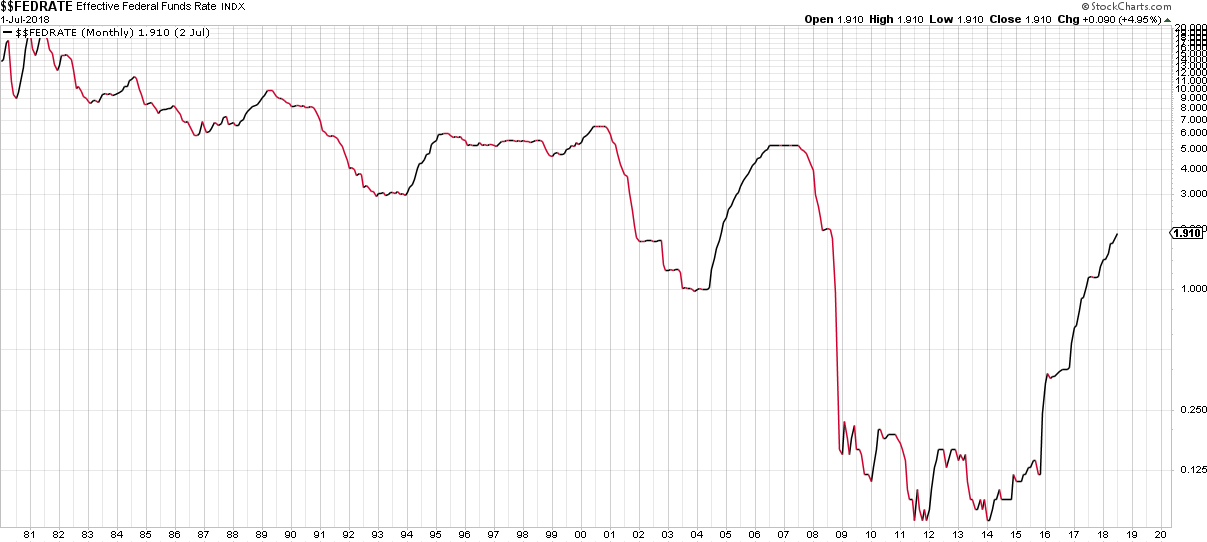
Why the sudden decline in housing? We believe the main issue is affordability. As the Federal Reserve has tightened credit conditions by raising interest rates and reducing their balance sheet, housing affordability has taken a hit (see chart below). Therefore, sales are starting to show weakness, and prices are following.
Even lumber prices are dropping, indicating a lack of demand (page 6). The home builders sector gave a sell signal earlier in the year and has been under increased pressure. The sector has failed to rally substantially, diverging from the broader market indices (page 7). This divergence is negative for housing, and potentially negative for broader consumption and the economy overall. If these conditions continue, the recent strength in the US economy could evaporate.
Author

Clint Sorenson, CFA, CMT
WealthShield


