What does the great disconnect imply for gold?

It seems that global stock markets have disconnected from the fundamental reality. They have been rising since the end of March despite the collapsing economies and soaring unemployment. Why? And what does it imply for the gold prices?
Let’s start with the brief review of the economic reality, focusing on China, as the country offers a preview of what is likely to happen in the West a bit later. In April, the industrial production grew 3.9 percent year-over-year, following the 1.1 percent decline in March, as the chart below shows. This is very good news for China’s economy. However, it might be too early to trump the full recovery. As a reminder, the industrial production in December 2019, before the outbreak of the pandemic, rose 6.9 percent.
Chart 1: Industrial production in China from April 2019 to April 2020
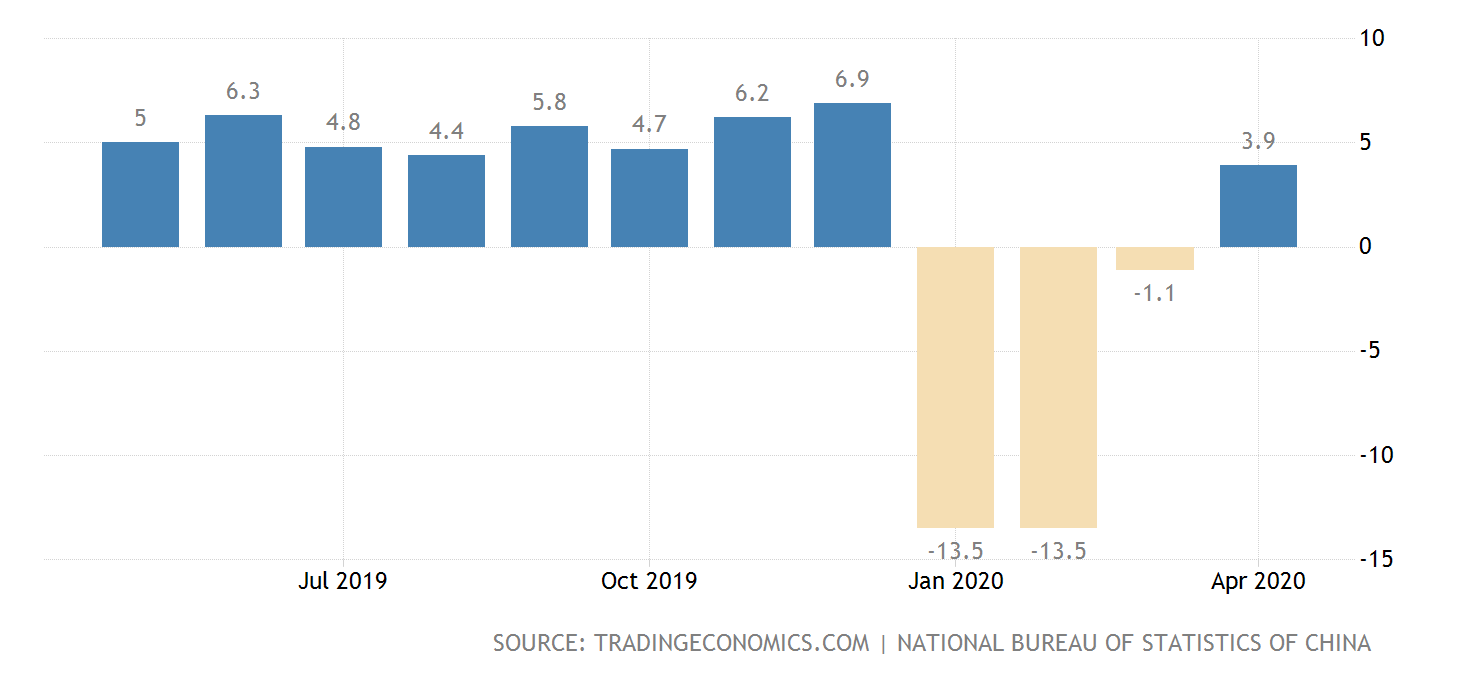
And the domestic demand remains very weak: the retail sales in China dropped 7.5 percent in April from a year earlier. Moreover, investment fell 10.3 percent in the January-April period on an annual basis, a modest improvement from the 16.1 percent drop posted in the first three months of the year, but still a negative growth below expectations.
The official unemployment rate reached 6 percent, up from 5.9 percent in March and just shy of February’s record of 6.2 percent. Of course, the true unemployment rate is likely twice as much as the official rate does not include people in rural communities and migrant workers. And remember that the global economy is expected to contract 3 percent in 2020, so this decline will negatively hit China, which is the world’s factory.
And there are also significant downside risks on the way to full normalization, with the risk of the second wave of the coronavirus and resulting reemergence of lockdowns being the most important threat for the steady economic recovery. Actually, this is actually materializing right now. According to the Bloomberg News, more than 100 million people in China’s northeast region, Jilin province, are once again under lockdown restrictions after new cases of COVID-19 have recently emerged.
The situation might be even worse, as the Financial Times’ China Economic Activity Index in mid-May was still below 80, where 100 is level seen on January 1, 2020. Many of its subindices, such as coal consumption, air pollution, container freight or box office numbers, remain subdued.
The conclusion is clear: China – and Western countries as well – can forget about the V-shaped recovery, as we have long ago warned. Instead, we could see a U-shaped recovery, which is deeper and more prolonged, or even a L-shaped recovery, which is even slower, although it might be too pessimistic a forecast. Or, there might be actually a mix of V, U, and L: in some industries the recovery will be quicker, while in certain industries – think airlines – it will be slower. Another possibility is that the recovery will look like W, i.e., there will be a rebound in one or two quarters, followed by another dip because of the second wave of epidemic.
The W-shaped recovery seems to be the most positive scenario for the gold market, as the second wave of injections would imply renewed worries and shaky economy. The slow recovery – U-shaped or L-shaped – will be better for the yellow metal than V-shaped, but they would not have to cause a rally in gold. After all, in the aftermath of the Great Recession, the recovery was very sluggish, but gold entered the bear market in 2011.
However, the performance of the global equity markets suggests that investors are rather optimistic about the future, at least this is the popular interpretation. Despite rising COVID-19 infections and deaths and the Great Lockdown, despite the collapsing economy and skyrocketing unemployment, the S&P 500 Index has been rising since March 23, as the chart below shows. We know that the stock market is not the real economy and that stock markets are forward-looking and do not want to fight the Fed, but the disconnect is troubling. After all, Mr. Market is not always correct – for example, it overlooked the risk of Covid-19 pandemic.
Chart 2: SP 500 Index (green line, left axis) and Dow Jones (red line, right axis) from January 2 to June 2, 2020
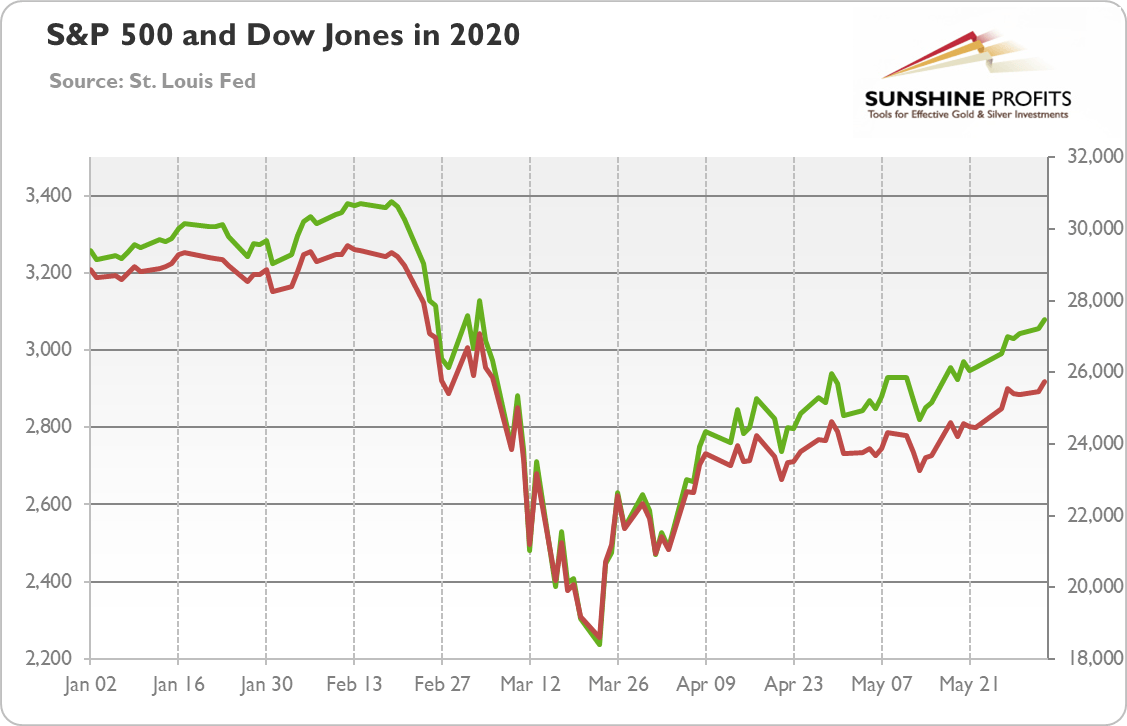
But the rising S&P 500 Index does not have indicate strong recovery on the horizon. This is because the rebound in the S&P 500 was driven by selected few companies, i.e., Microsoft, Apple, Amazon, Alphabet, and Facebook – the relative winners during the Great Lockdown that forced people to shift into the online world. Moreover, the behavior of cyclical commodities and bond yields suggest rather weak recovery.
What does it mean? Well, the fundamental outlook does not bode well for equity markets. Given the expected decline in the GDP, the earnings per share for companies listed on the S&P 500 will likely fall by 10-20 percent versus expectations from the beginning of 2020. So, the stock market capitalization from end of May of about 3,000 implies the P/E is higher than before the pandemic! Maybe we should believe more in the collective wisdom of the crowds, but today’s equity valuations appear to be at odds with the fundamental reality. The selected few companies will not drive the broad market forever.
We do not say that the stock market crash is imminent, but rather that at least a correction might happen, which could be positive for the gold prices, although the initial downward move could pull the yellow metal down. In other words, investing in the stock market seems to be risky right now given that the V-shaped recovery is unlikely and given elevated equity valuations, so adding gold, which is good portfolio’s diversifier, to the portfolio might be a smart move.
Want free follow-ups to the above article and details not available to 99%+ investors? Sign up to our free newsletter today!
Want free follow-ups to the above article and details not available to 99%+ investors? Sign up to our free newsletter today!
Author

Arkadiusz Sieroń
Sunshine Profits
Arkadiusz Sieroń received his Ph.D. in economics in 2016 (his doctoral thesis was about Cantillon effects), and has been an assistant professor at the Institute of Economic Sciences at the University of Wrocław since 2017.


