We’re Seeing Frothy Stocks

Here’s an interesting divergence. Just as stocks head straight up since early October into what looks like the final blow-off phase of this bubble, 97% of corporate CFOs see a recession starting by the end of 2020.
Tons of Silicon Valley start-ups are looking to go public this year to beat a recession expected by 2021. That’s perfect to occur into a tech bubble top as into 2000.
This rally since the biggest correction since 2009 into December 2018, is tracking with the blow-off rally from 1998 into 2020 to peak around late May at as high as 11,000 Nasdaq. I’ll have more on that on Wednesday…
But here’s another divergence. The ISM Manufacturing index is a good leading indicator, and it is pointing down 10% while the S&P 500 has surged 30% recently. Here’s the chart…
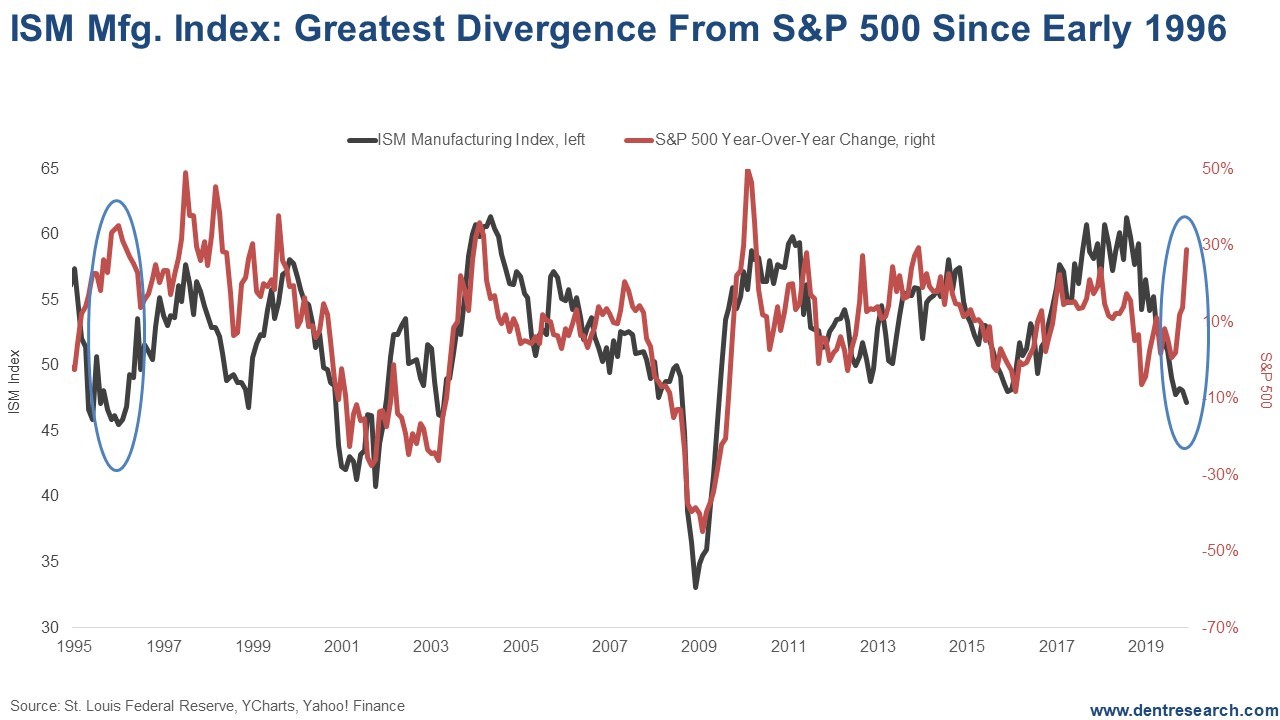
This is the biggest divergence since early 1996, at the early stage of the first tech bubble. The other similar divergence was in late 1989/early 1990, before 1990’s 20% crash, the largest between 1987 and 2000.
Why? The largest monetary injections by the Fed, as I covered last Wednesday. By the way, we had some erroneous data from a Wall Street Journal article, and the cumulative “repo madness” money printing since September has been $425 billion instead of $505. But plans are still to print $80 billion a month ahead in normal QE, plus repos as needed, which means likely $110-$140 billion a month vs. $60 billion at peak QE in the past.
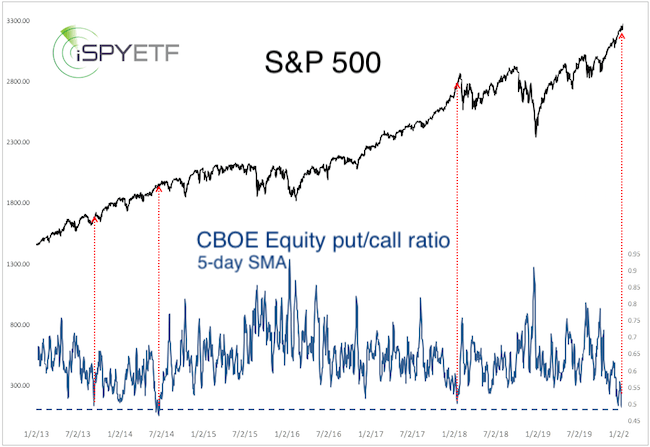
The put/call ratio at 0.45 is the most extreme since January 2018, just before that bubble-like peak, so stocks are short-term overbought. So, we could see some sort of correction any day…
But stocks just keep melting up with record flows of funny money into the financial asset pool on Wall Street. Forget the excuses that “this is just a temporary repo imbalance.” This is a full-out, even more aggressive form of QE. Any money injected into the financial asset arena – repos, T-bills, bonds, etc. – ends up with more money chasing the same assets and always migrates most to the highest gains from stocks, creating financial asset bubbles – period!
Repo madness, IPO madness, bad news doesn’t matter… This is all a clear sign of the final mania phase of this bubble, which started in early 2009 and is now the longest and most globally pervasive in history.
Best projection at this time: stocks continue up strongly into mid-year, then the volatility starts when economic slowing becomes more obvious than it already is now to corporate CFOs.
Author

Harry S. Dent, MBA
Dent Research
Harry S. Dent Jr. studied economics in college in the ’70s, but found it vague and inconclusive. He became so disillusioned by the state of his chosen profession that he turned his back on it.


