Weekly waves: EUR/USD, GBP/USD, and Bitcoin
-
The EUR/USD bullish breakout is indicating the end of the current downtrend and the bearish price swing (wave 3 gray).
-
The current BTC/USD correction seems to be a wave 4 (green) of a wave 5 (orange) of a larger ABC correction (pink) in wave 4 (gray).
-
After the GBP/USD correction is completed, one more bearish price swing should create a new lower low to complete wave 5 (gray) of wave C (pink).

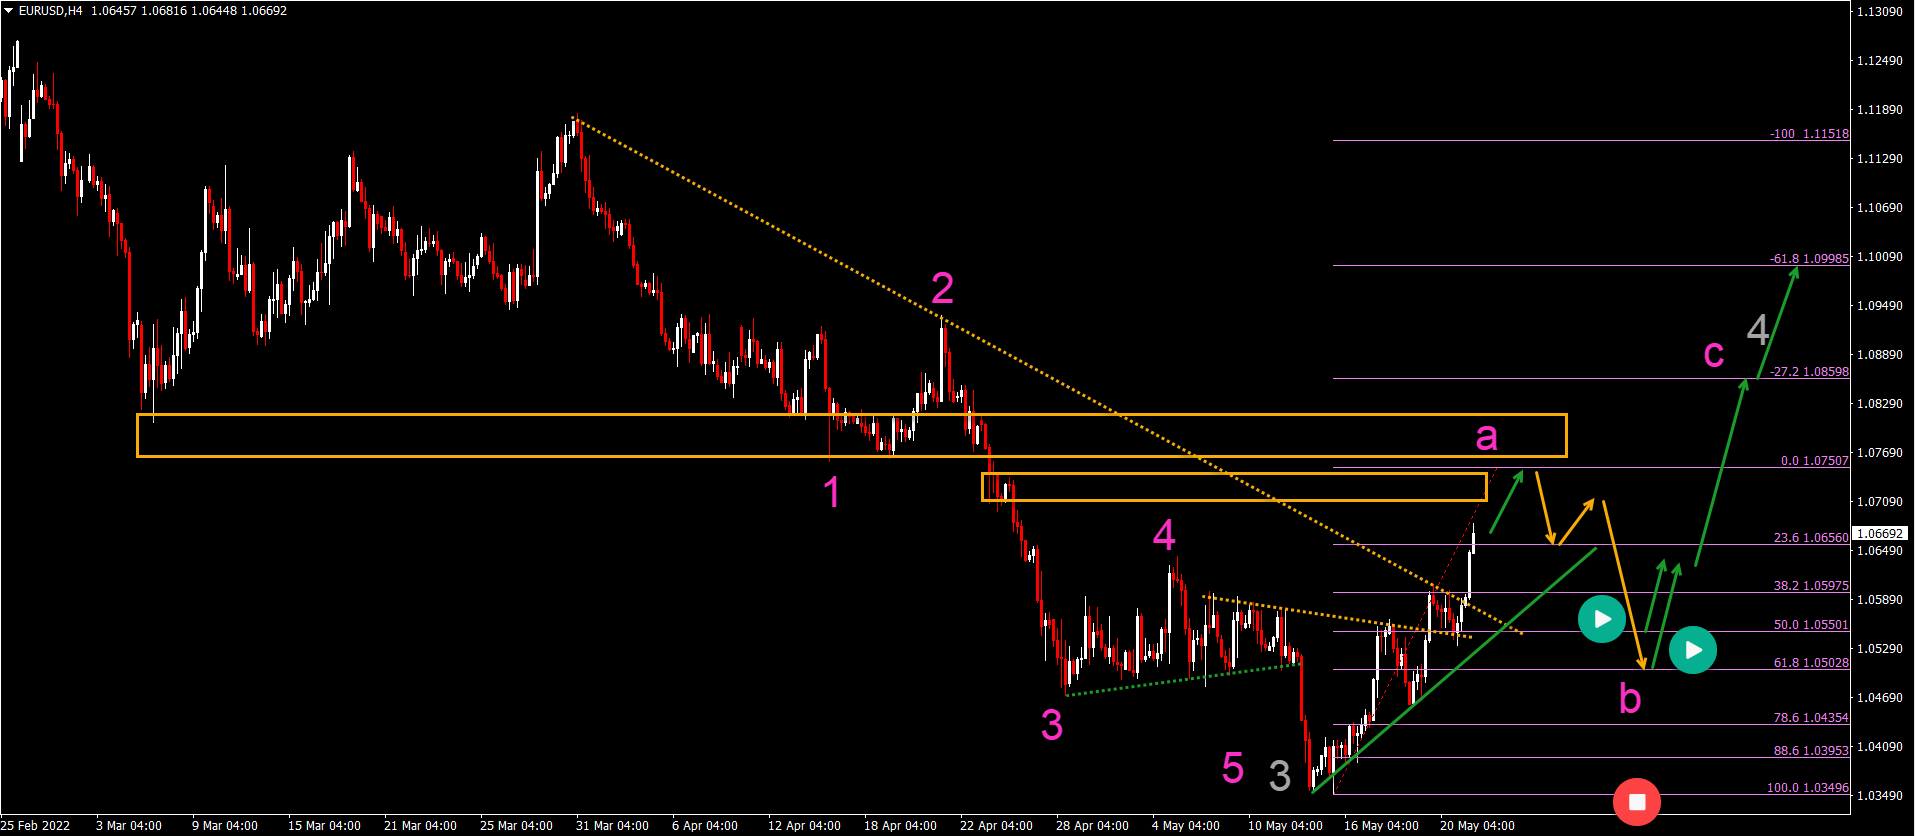
EUR/USD aiming for 1.10 bullish target
The EUR/USD is breaking above the resistance trend lines (dotted orange). Let’s review what this means for the EUR/USD:
-
The EUR/USD bullish breakout is indicating the end of the current downtrend and the bearish price swing (wave 3 gray).
-
A bullish ABC (pink) pattern is expected. This is probably within wave 4 (gray).
-
The wave A (pink) is expected to aim and stop at a resistance zone around 1.0750-1.08.
-
A bearish ABC pullback (orange arrows) should take price back down again to the 50-61.8% Fibonacci support zone.
-
A bullish bounce (green arrows) at the 50-61.8% Fibonacci level should see another bullish swing take price up to the Fibonacci targets as high as 1.10.
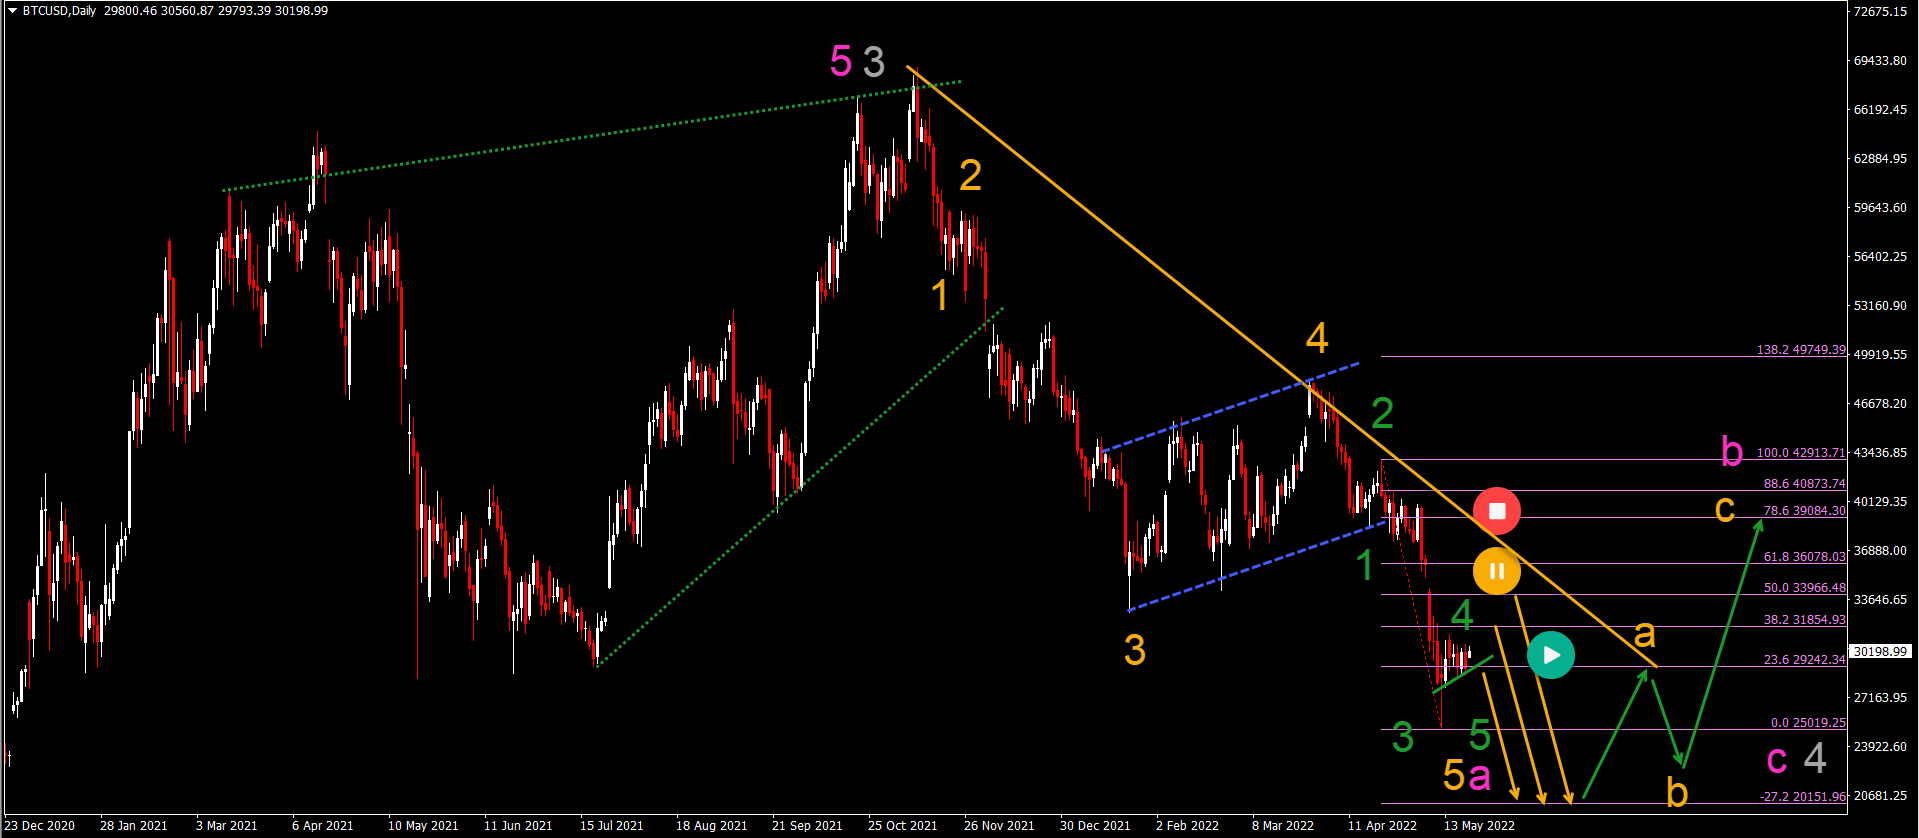
BTC/USD approaches the end of bearish correction
Bitcoin (BTC/USD) is building a mild bullish correction within a strong downtrend:
-
The BTC/USD topped out at the all-time-high after building a rising wedge reversal chart pattern (dotted green lines).
-
Since creating that top, the bearish decline has been strong. The bearish swing seems to be unfolding in 5 waves (orange).
-
The recent bear flag pattern (dotted blue lines) was probably part of a wave 4 (orange).
-
The current correction seems to be a wave 4 (green) of a wave 5 (orange) of a larger ABC correction (pink) in wave 4 (gray).
-
Keep in mind that the ABC (pink) could be part of a wave W of a larger WXY complex correction.
-
As long as price action respects the Fibonacci 38.2-50% resistance levels, one more lower low is still expected. After that, a bullish bounce (green arrows) could emerge.
-
A break above the resistance line (orange) could indicate an immediate uptrend.
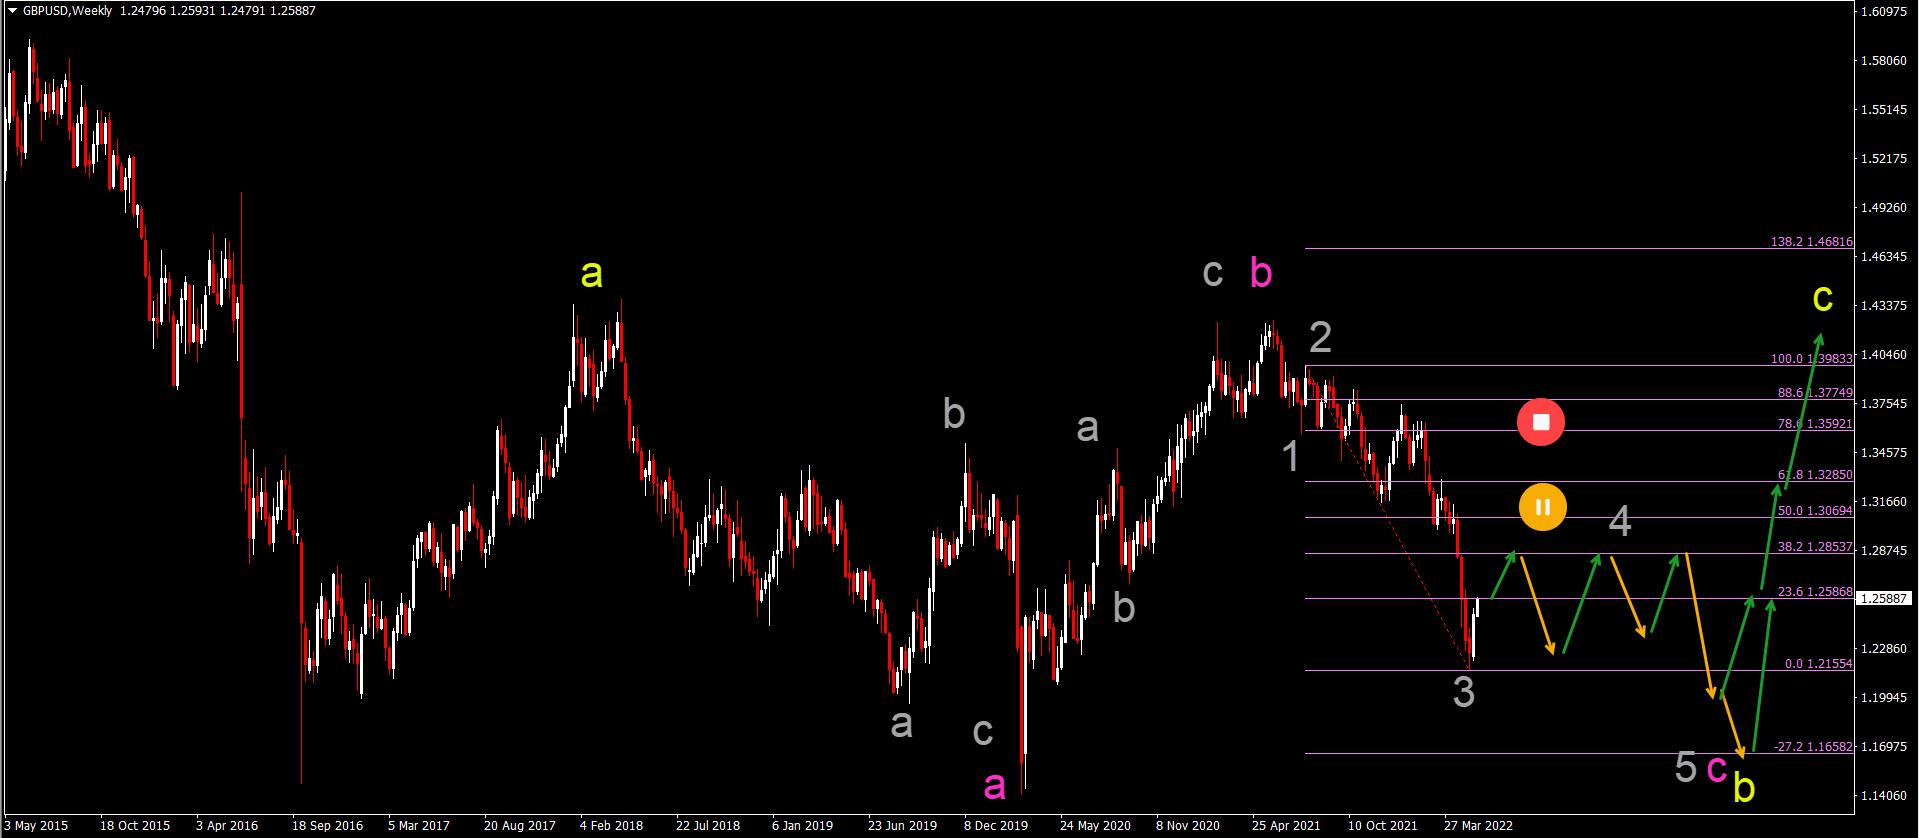
GBP/USD bearish wave three completed
The GBP/USD is testing the historical lows and support zone:
-
The GBP/USD bearish decline has been very impulsive so far.
-
The recent candlestick pattern on the weekly chart shows a strong bullish weekly candle. This could indicate that the wave 3 (gray) is completed.
-
If the wave 4 (gray) has indeed started, then price action could build a lengthy and choppy correction which should usually stay below the 50% Fibonacci level.
-
A break above the 50-61.8% Fibonacci level makes the bearish wave 4-5 (gray) within wave C (pink) unlikely. In that case, a bullish swing is expected.
-
After the correction is completed, one more bearish price swing should create a new lower low to complete wave 5 (gray) of wave C (pink).
-
An ABC (pink) pattern seems to be completing a wave B (yellow) of a larger ABC (yellow).
The analysis has been done with the indicators and template from the SWAT method simple wave analysis and trading. For more daily technical and wave analysis and updates, sign-up to our newsletter
Author

Chris Svorcik
FS method
Chris Svorcik is a trader, analyst, and educator with over 15 years of experience in financial markets, specializing in moving averages, market structure, and price patterns.


