Weekly waves: EUR/USD, Bitcoin, and US 30
-
Our outlook has become a little more bearish on all 3 instruments - although a bullish correction is expected to emerge after the bearish swing is completed.
-
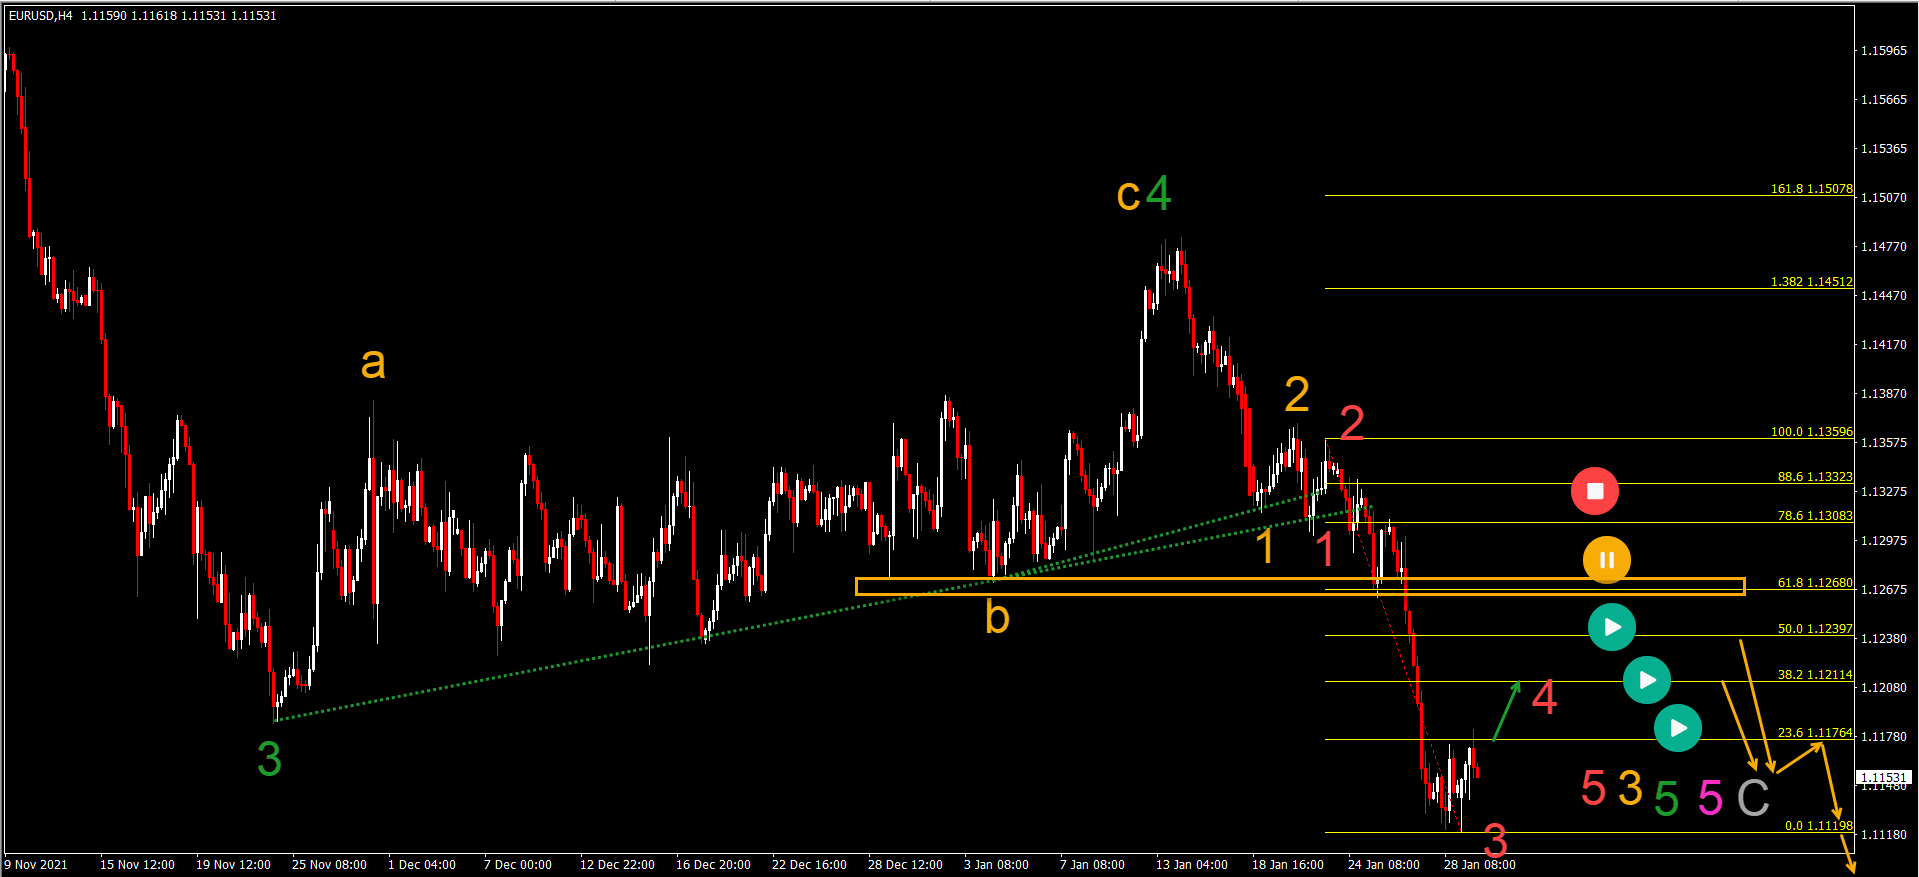
The EUR/USD made the bearish breakout below the support trend lines (dotted green) as mentioned in last week’s Elliott Wave analysis:
-
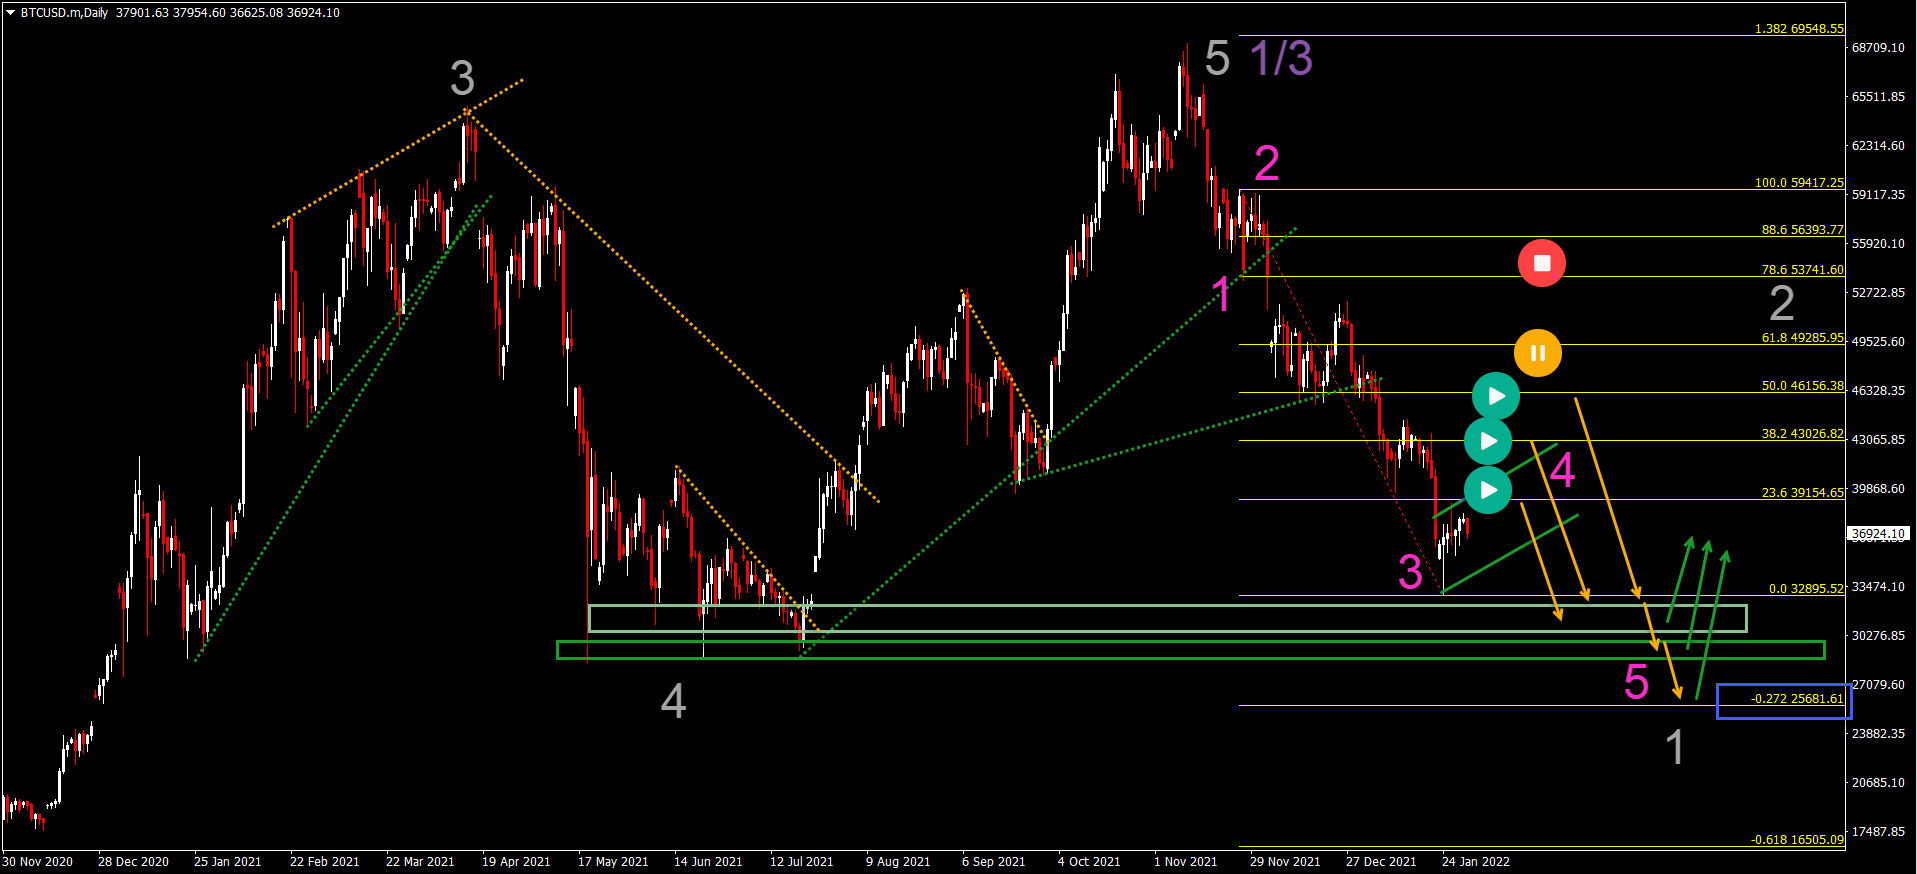
The Bitcoin crypto pair (BTC/USD) seemed to have completed a bearish wave A last week. But this week we decided to make a revision to that Elliott Wave forecast.

Our weekly Elliott Wave analysis reviews the EUR/USD, the Bitcoin cryptocurrency, and the US30 stock market
EUR/USD downtrend resumes towards 1.10
-
The bearish momentum showed decent strength and is likely a wave 3 (red) price swing. The bullish correction is expected to be a choppy wave 4 (red).
-
The wave 4 usually retraces to and bounces at a shallow Fibonacci retracement level such as the 38.2% Fib (or 23.6% and 50%).
-
An unexpected bullish breakout above the resistance (orange box) places this wave 3-4 analysis on hold (orange circle). A deep push higher (red circle) invalidates it. A bearish continuation (orange arrows) is expected to aim at the target zone around 1.10.
BTC/USD changes to wave four pattern
-
The bullish correction has been relatively slow and choppy. Price action made a retracement only up to the 23.6% Fibonacci retracement level so far.
-
Therefore, price action could easily be in wave 4 (pink) correction of a larger wave 1 (gray) - as long as price action remains below the 50% Fibonacci level.
-
A deep bullish push places the Elliott Wave analysis on hold (orange) or invalidates it (red).
-
A bullish bounce is expected at the Fibonacci target or support areas (green boxes) due to end of the wave 1 (gray) and the start of wave 2 (gray).
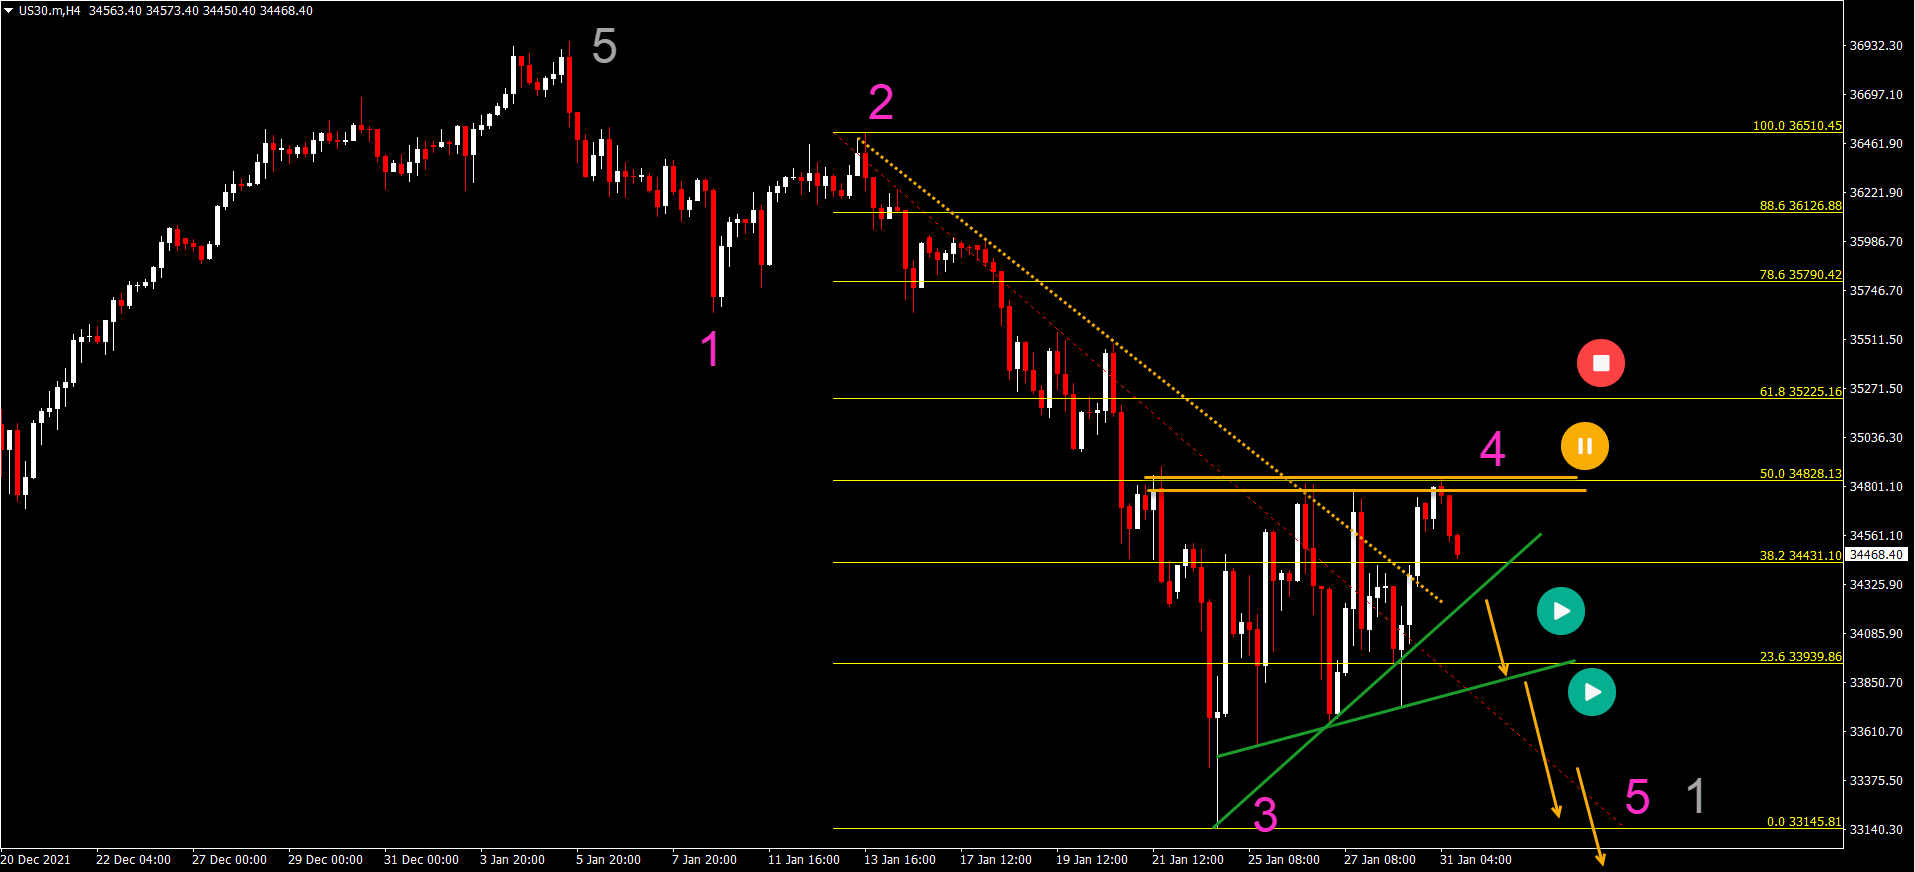
US30 choppy pattern remains a weak signal
The US30 chart is also showing bullish weakness. The choppy and corrective pattern indicates that the bulls were unable to retake control at a support zone:
-
The US30 chart is also showing bullish weakness. The choppy and corrective pattern indicates that the bulls were unable to retake control at a support zone: Price action has respected the 50% Fibonacci resistance retracement level three times in a row. The triple top could indicate a wave 4 (pink) pattern.
-
A bearish breakout below the support trend lines (green) could indicate a continuation of the downtrend (orange arrows).
-
A bullish breakout would make it more likely that the bearish swing is not a wave 3 (pink) but rather the end of wave 5 of wave 1 or wave A. (see attachment US30).
The analysis has been done with the indicators and template from the SWAT method simple wave analysis and trading. For more daily technical and wave analysis and updates, sign-up to our newsletter
Author

Chris Svorcik
FS method
Chris Svorcik is a trader, analyst, and educator with over 15 years of experience in financial markets, specializing in moving averages, market structure, and price patterns.


