Weekly waves: Bitcoin bearish reversal plus EUR/USD and GBP/AUD daily charts
-
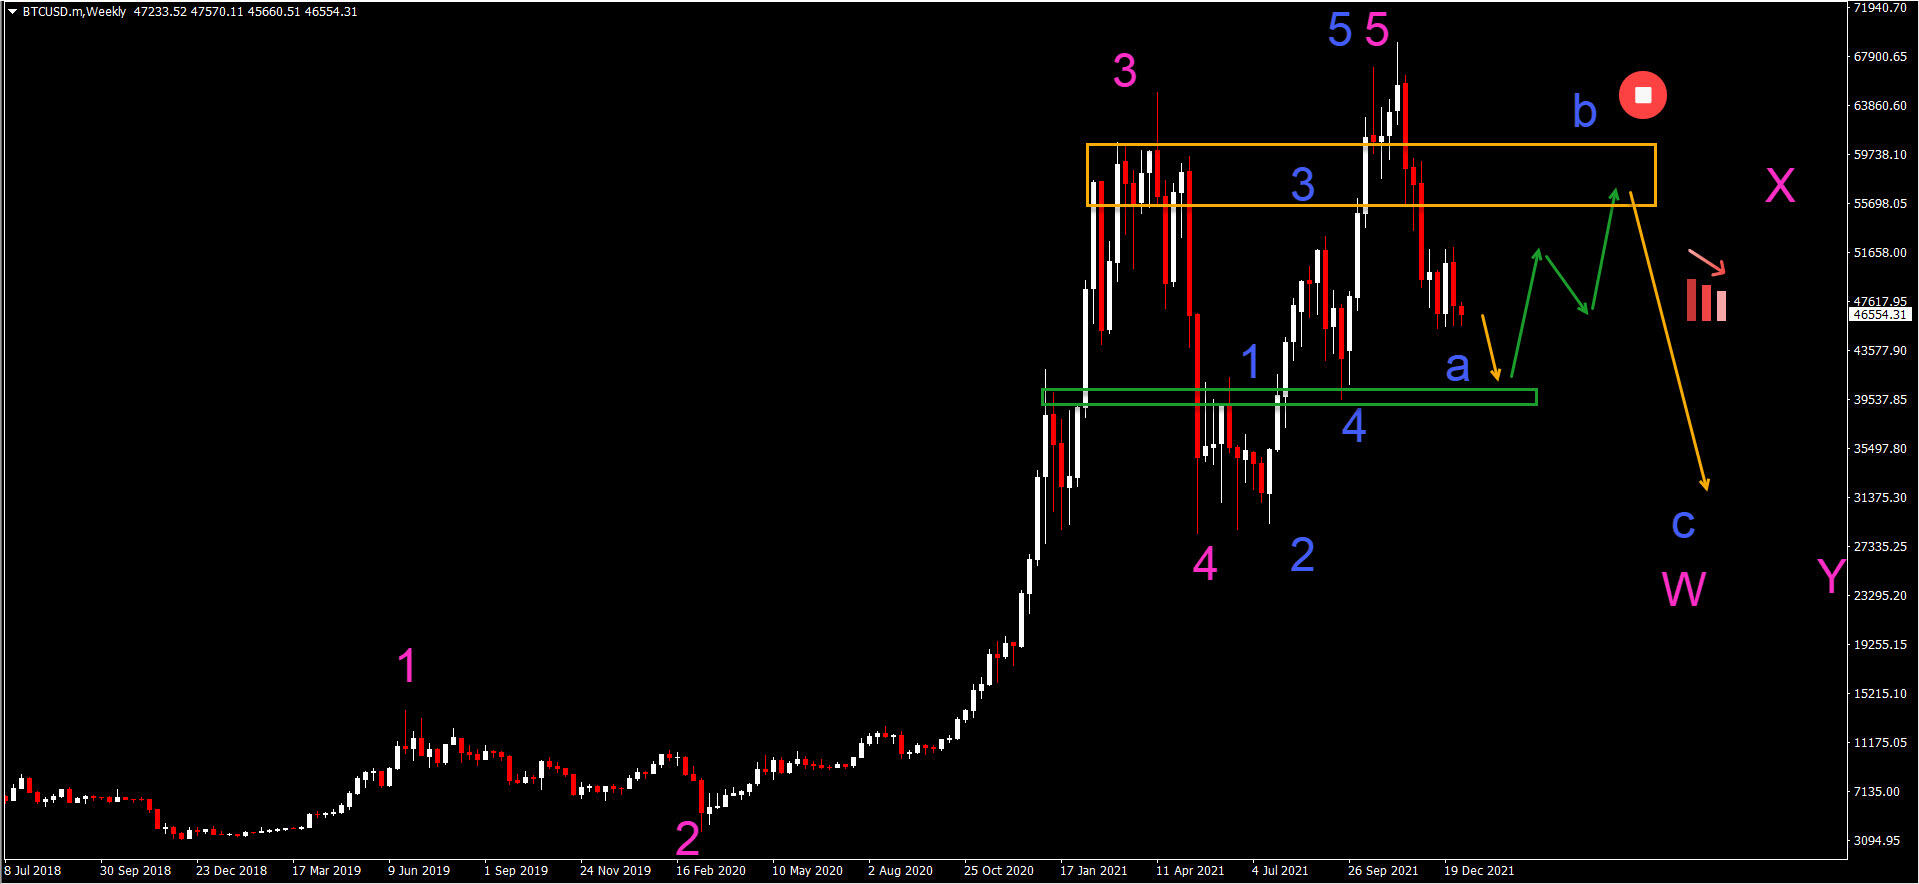
Bitcoin (BTC/USD) weekly chart is showing a potential bearish reversal. The uptrend could be completed after 5 bullish waves up.
-
The current pullback is probably a bear flag (purple lines) within the wave 4 (blue). A break below (orange arrow) the flag confirms the downtrend continuation.
-
The BTC/USD chart remains in an uptrend but the bearish pressure is placing it under severe pressure. The higher high was quickly followed by a fast decline.

We also review the EUR/USD downtrend and GBP/AUD triangle pattern on the daily charts.
Bitcoin bearish momentum vs uptrend
-
A 5 wave (pink) pattern seems to be completed. There is also a clear 5 wave pattern (blue) in the final 5th wave (pink).
-
Price made a higher high but the bulls were unable to hold ground. The quick bearish decline showed a lot of bearish momentum. The bearish drop could be a wave A (blue).
-
A new lower low is expected (orange arrow) to test the support zone (green) first. A bullish bounce (green arrow) could test the resistance zone (orange).
-
A bearish bounce at the resistance would confirm that the uptrend is indeed over.
-
A larger, complex bearish correction could take place via a WXY (pink) pattern. In case, the uptrend continues, then it is likely that a triangle pattern will emerge first.
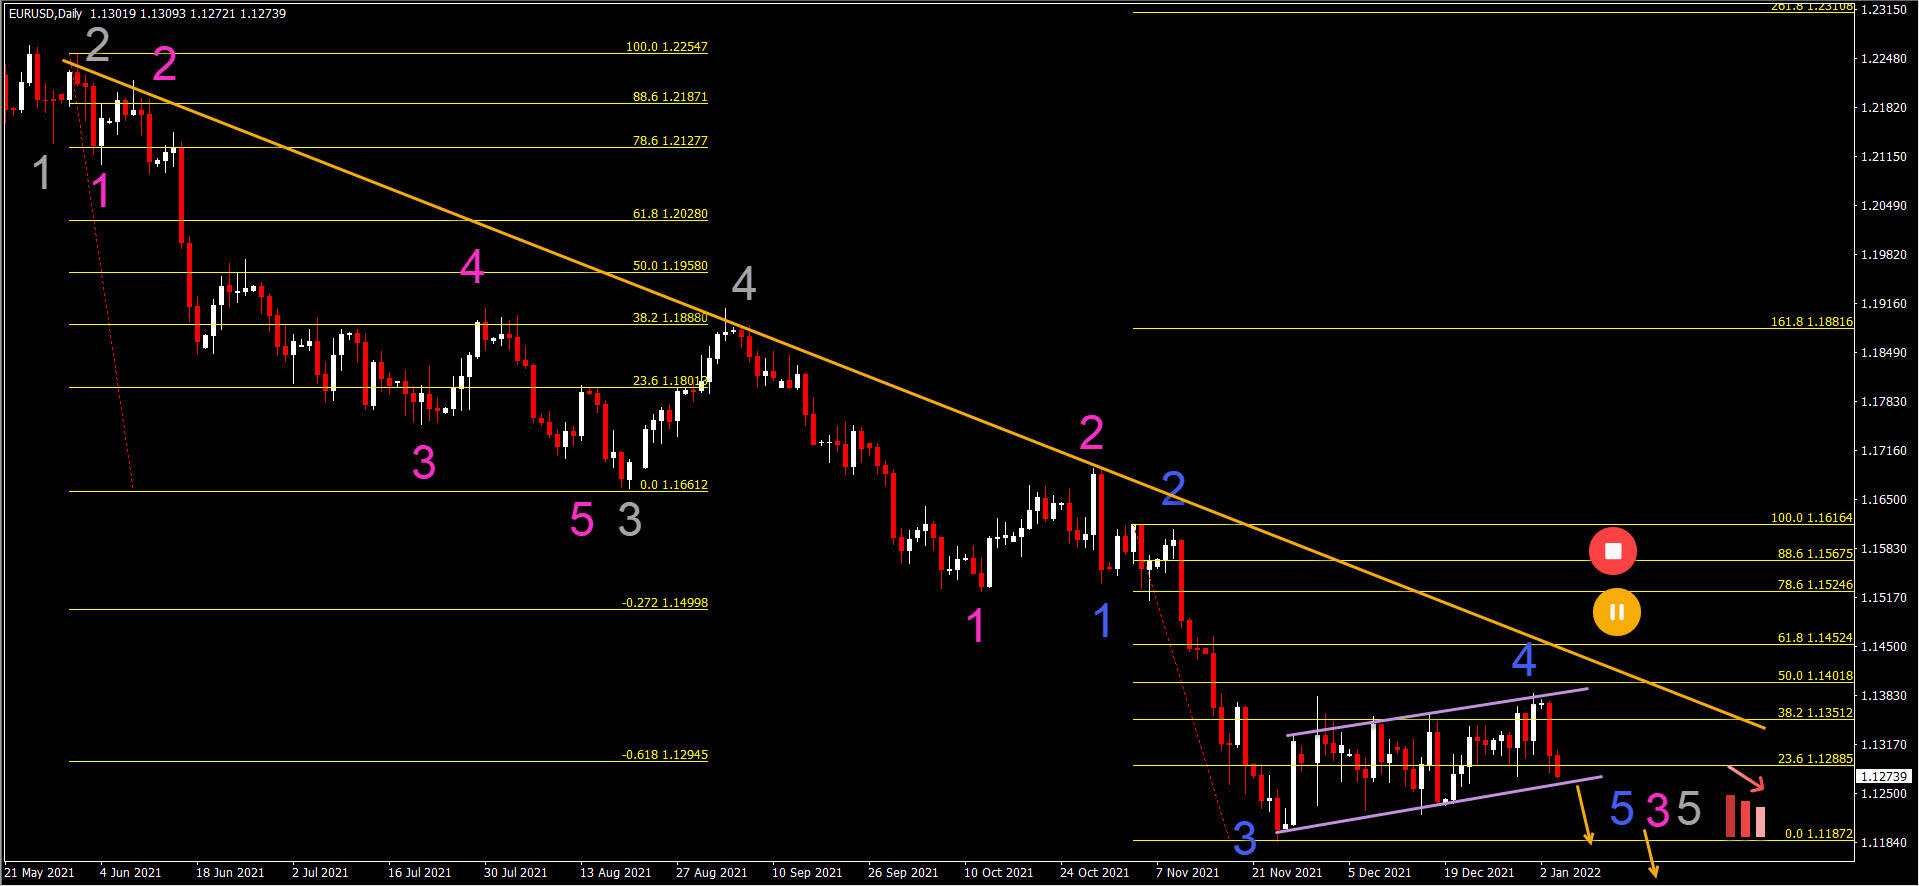
EUR/USD downtrend continuation
The EUR/USD downtrend is strong. The resistance trend line (orange) indicates how long the bears have been in control:
-
The current decline is a bearish impulsive wave. There seem to be 5 waves (grey) developing at the moment.
-
The current pullback is probably a bear flag (purple lines) within the wave 4 (blue). This is invalid if the retracement breaks above the 78.6% Fibonacci level. A break below (orange arrow) the flag confirms the downtrend continuation.
-
The main target for the downtrend is the round level of 1.10.
-
The downtrend could be part of a wave 5 (blue) of wave 3 (pink) of wave 5 (grey).
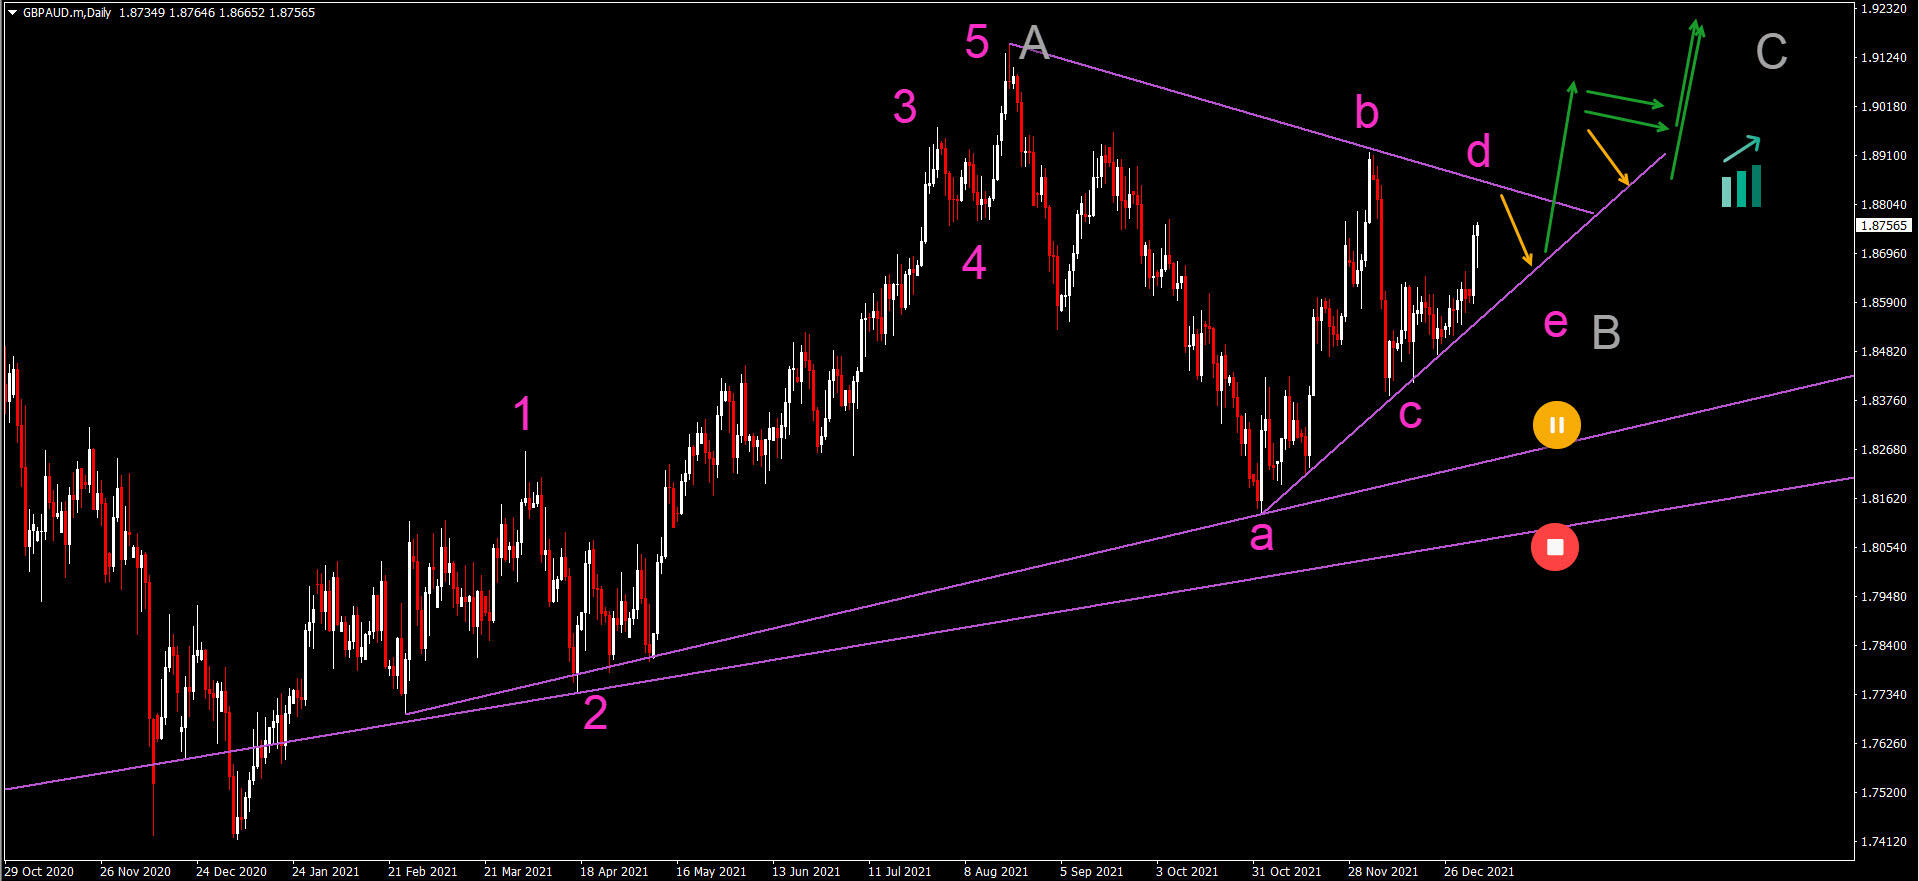
GBP/AUD in consolidation
The GBP/AUD chart is showing an uptrend with support trend lines (purple) below the current price:
-
After 5 waves up (pink), price is making a consolidation. The correction could be an ABCDE (pink) pattern.
-
The current outlook remains valid if price action stays above the bottoms.
-
A break above the resistance trend line could spark a bullish breakout and rally.
The analysis has been done with the indicators and template from the SWAT method simple wave analysis and trading. For more daily technical and wave analysis and updates, sign-up to our newsletter
Author

Chris Svorcik
FS method
Chris Svorcik is a trader, analyst, and educator with over 15 years of experience in financial markets, specializing in moving averages, market structure, and price patterns.


