Weekend Report Preview
The Dollar
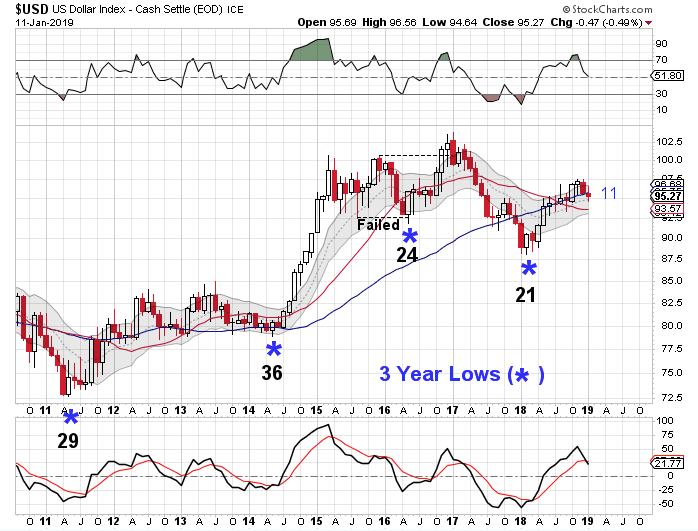
The dollar formed a swing low on Friday.
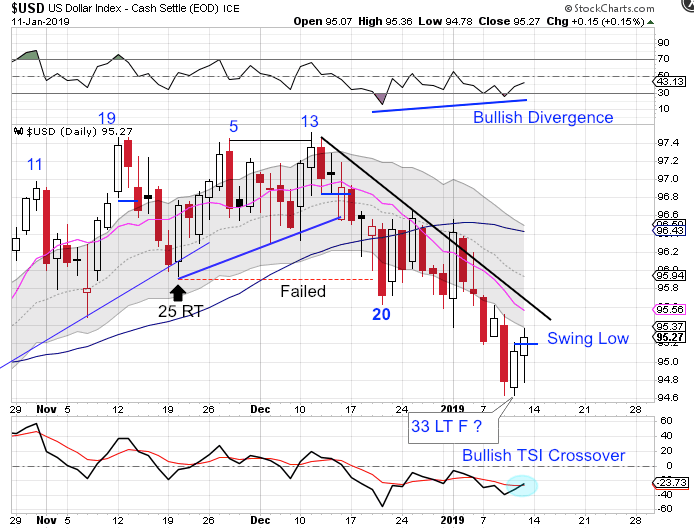
The dollar printed its lowest point on Thursday, day 33, placing it deep in its timing band for a DCL. At 33 days, the dollar is due for a DCL. Therefore Friday's swing low signals a new daily cycle. A close above the 10 day MA will confirm the new daily cycle. The dollar is in a daily downtrend. It will remain so unless it closes above it the upper daily cycle band.
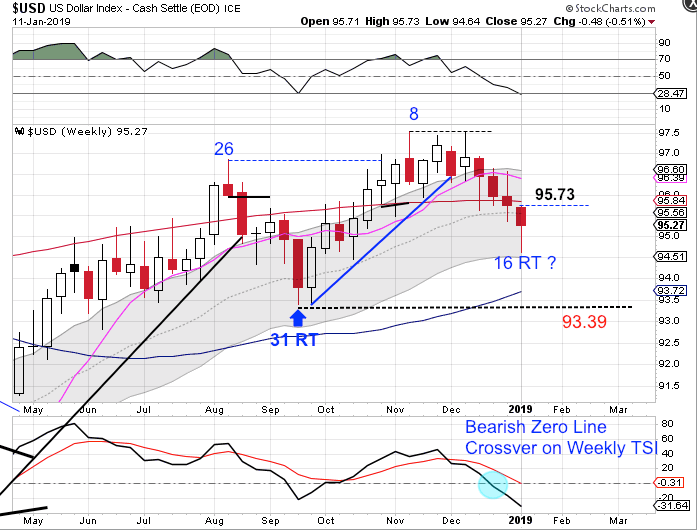
This was week 16 for the weekly dollar cycle. Which leaves enough time for 1 more daily cycle to usher in the ICL. However the dollar formed a bullish weekly reversal, which eases the parameters for forming a weekly swing low. If the dollar forms a weekly swing low and closes back above the 200 week MA we will label week 16 as an early intermediate cycle low. The dollar is in a weekly uptrend. If a weekly swing low forms above the lower weekly cycle band it will remain in its weekly uptrend.
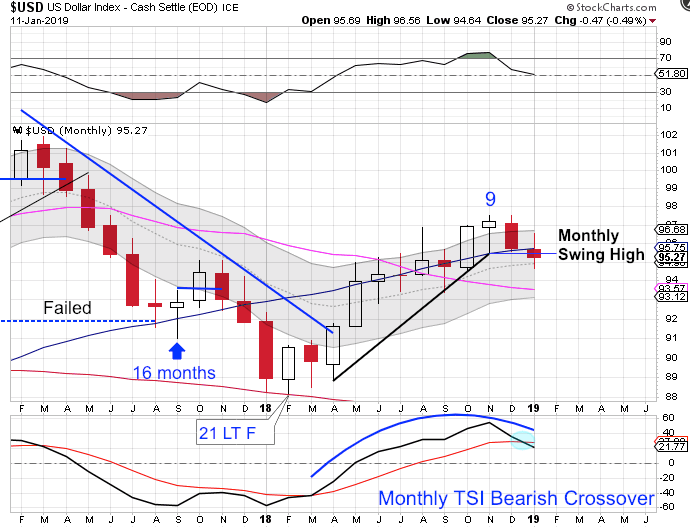
January is month 11 for the yearly dollar cycle placing the dollar in its timing band for a yearly cycle low. A monthly swing high has formed. A failed intermediate cycle is needed to complete the yearly cycle decline. Either we will see this intermediate cycle fail or the dollar will need another intermediate cycle, which will extend the yearly cycle.
So if the dollar forms a weekly swing low and closes back above the 10 week MA, that would signal that week 16 hosted an early ICL and that the dollar needs a left translated, failed weekly cycle to usher in the yearly cycle low.
But since this is only week 16 for the intermediate cycle, it is still possible for the intermediate cycle to left translated and fail. The dollar would need to print another left translated, failed daily cycle. Under this scenario that would lead to a failed weekly cycle and the yearly cycle decline.
Closing above the upper monthly cycle band in October confirms that February hosted the 3 year cycle low. The 15 year super cycle decline has begun. As long as the dollar does not form a higher yearly cycle high then it will remain in its 15 year super cycle decline.
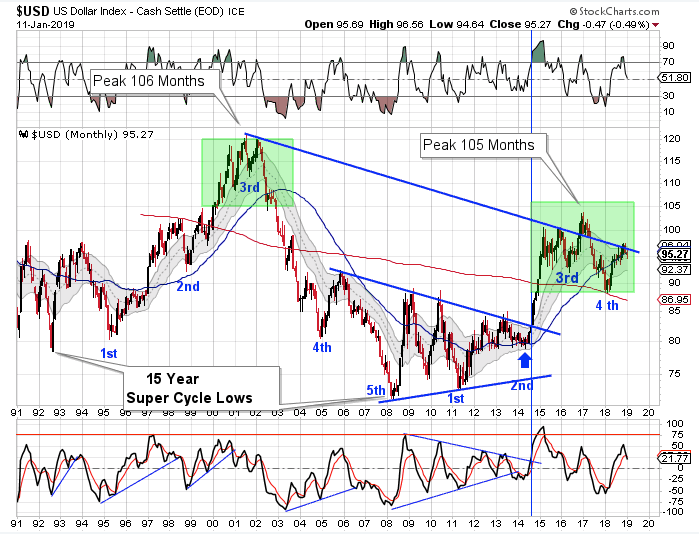
The dollar cycles through a 15 year super cycle. Each 15 year super cycle is embedded with five 3 year cycles. The dollar’s last 15 year super cycle peaked in 2001 on month 106, then declined into its third 3 year cycle low. The topping pattern in 2001 is similar to the current set up. The confirmation of a failed 3 year cycle back in August, 2017 confirms that the dollar has begun its 15 year super cycle decline (bear market). Therefore we are looking for the dollar to be rejected by the declining multi year trend line to continue its decline into the 15 year super cycle low.
Stocks
Friday was day 11 for the daily equity cycle. Our expectation is to see this first daily cycle right translate, which means it should peak on or after day 20.
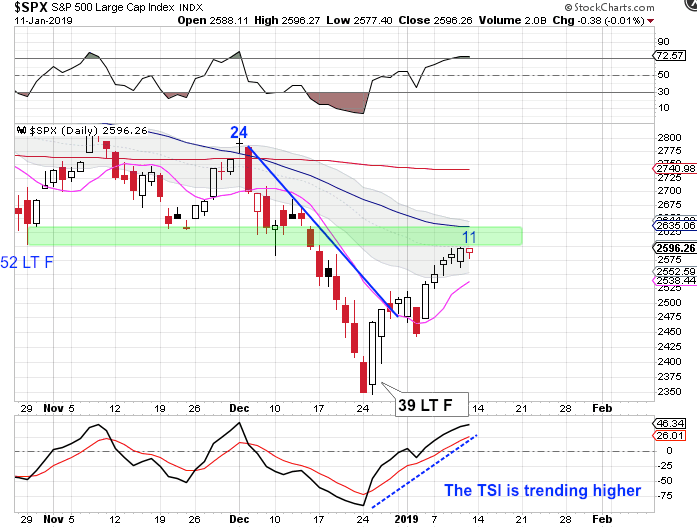
However, stocks are running into a resistance zone just below the 50 day MA. Stocks may consolidate here, which would allow the 10 day MA to catch back up to price. Stocks are still in a daily downtrend. They will remain in its downtrend until they close above the upper daily cycle band.

The weekly charts are turning bullish. Stocks formed a weekly swing low the previous week and delivered bullish follow through this week. Stocks still need to break above the declining trend line for final confirmation of the new intermediate cycle. And since we suspect this to also mark the yearly cycle low, then our expectation is to see the intermediate cycle right translate and peak on or after week 14. Stocks are in a weekly downtrend. They will remain in its downtrend unless they close above the upper weekly cycle band.
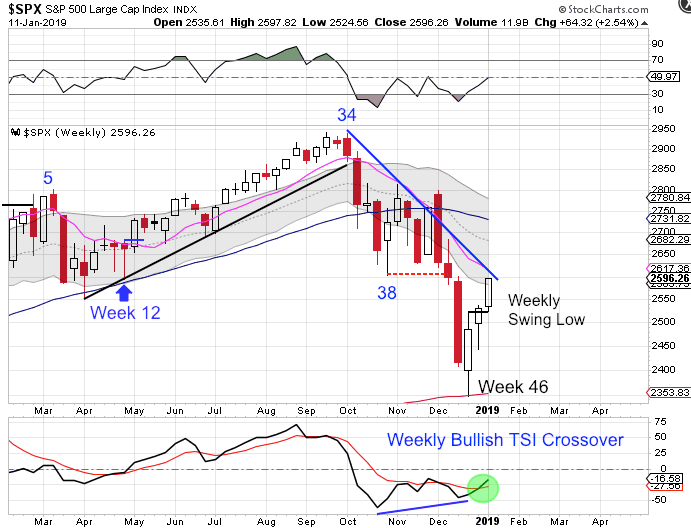
December was month 10 for the yearly equity cycle, placing stocks in their timing band for a yearly cycle low. Therefore, the new intermediate cycle should trigger the start of a new yearly cycle. A monthly swing low is required to form a yearly cycle low. A break above 2800.18 will form a monthly swing low.
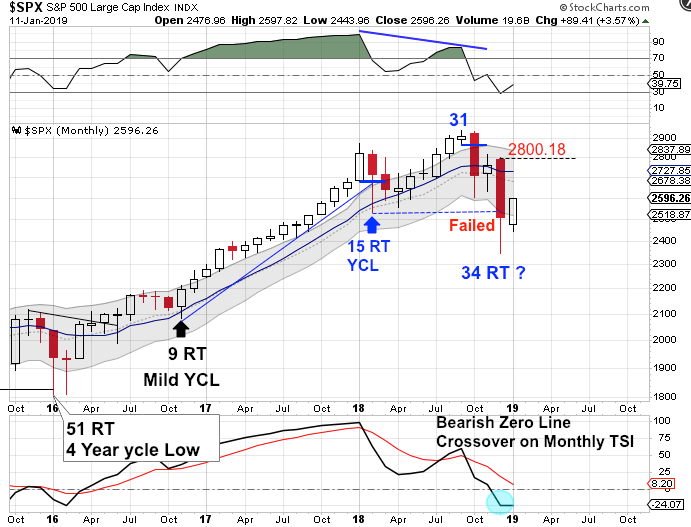
Stocks print their multi-year cycle low on average every 44 months. The last multi-year low formed in 2016 at 51 months. With that multi-year cycle being slightly stretched indicates that this one could be shortened. Therefore it is possible that December hosted a shortened, 34 month, multi-year low. A close back above the upper monthly cycle band will indicate that December was the multi-year low. However, if a monthly swing high forms below the upper monthly cycle band - then that would signal a continuation of the multi-year cycle decline.
Author

LikesMoney
Independent Analyst
Assets (such as stocks, gold, and the dollar) have identifiable cycles.


