Weekend Report Preview

The Dollar
The dollar's daily cycle peaked on day 17. It printed is lowest on Wednesday, day 23, forming a bullish reversal off of support from the 50 day MA.
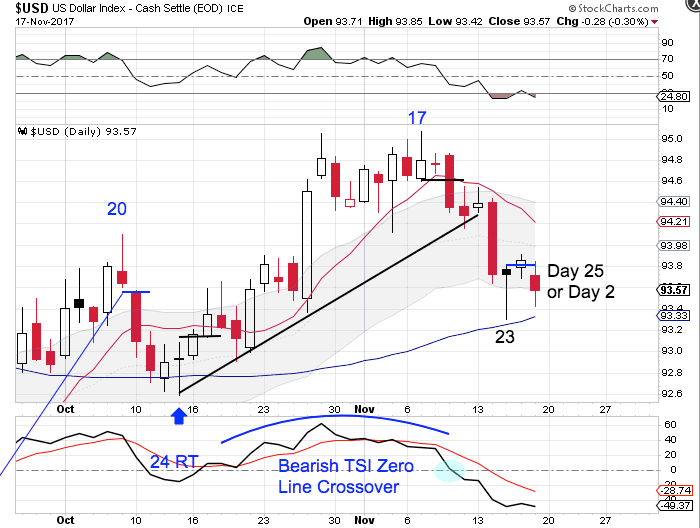
The dollar is in its timing band for a DCL. It did form a swing low on Thursday, but broke lower on Friday. The dollar still needs to close back above the declining 10 day MA in order to confirm that day 23 hosted the daily cycle low. The dollar did not close below the lower daily cycle band on Friday so it does remain in a daily uptrend. It will continue in its uptrend unless it closes below the lower daily cycle band.
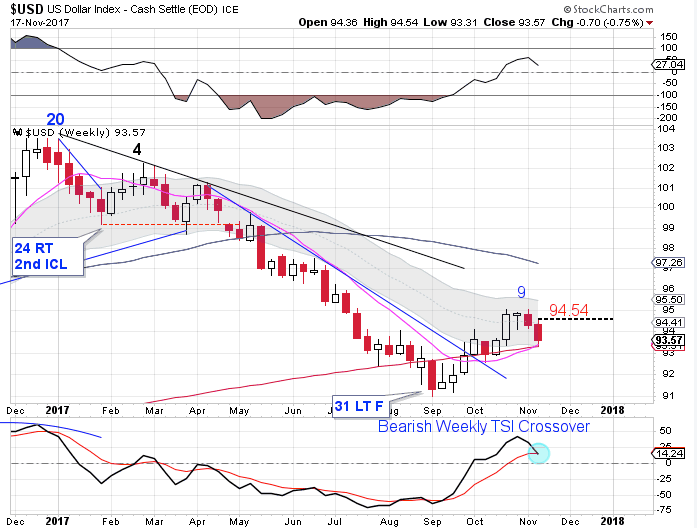
The dollar may have formed a DCL on Wed. If so, then that would have been off of support of the converging 10 week MA & the 200 week MA. A weekly swing low here will allow us to construct a weekly trend line. However should the dollar close below both the 10 week MA and the 200 week MA then that would be enough for me to confirm that the dollar has begun its intermediate cycle decline. The dollar is in a weekly downtrend & will remain so unless it closes above it the upper weekly cycle band.
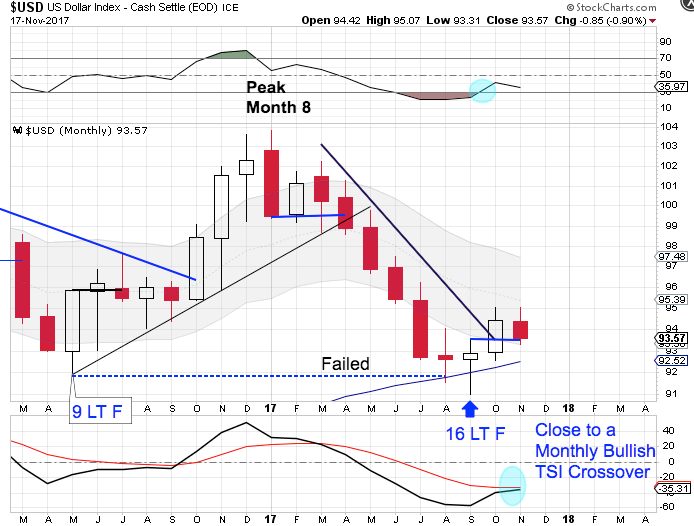
The dollar printed its lowest point in September, month 16. A monthly swing low formed in October along with a break above the declining monthly trend line to confirm the new yearly cycle. However, the dollar has begun a monthly downtrend. The dollar will remain in its monthly downtrend until it can close back above the upper monthly cycle band.
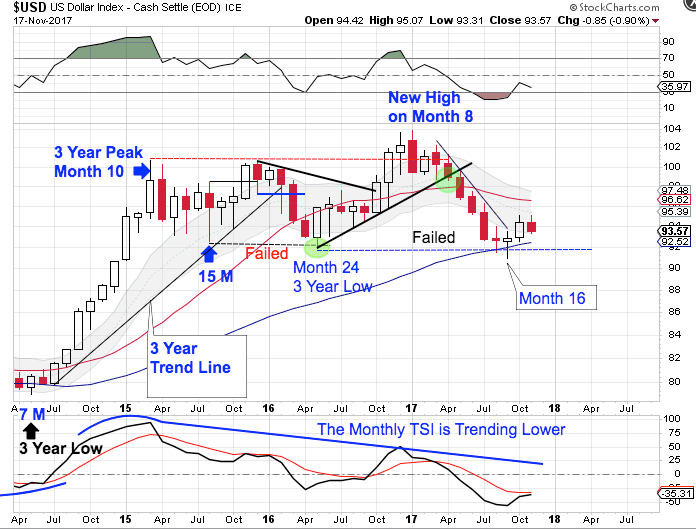
The dollar broke below the previous 3 year cycle low in September to form a failed 3 year cycle. The remaining yearly cycles should now form as left translated yearly cycles until the next 3 year cycle low forms. I suspect that the dollar will be rejected by the 20 month MA to continue its 3 year cycle decline. And with confirmation of a failed 3 year cycle, this sets up as a left translated 3 year cycle. That aligns with our 15 year super cycle analysis.
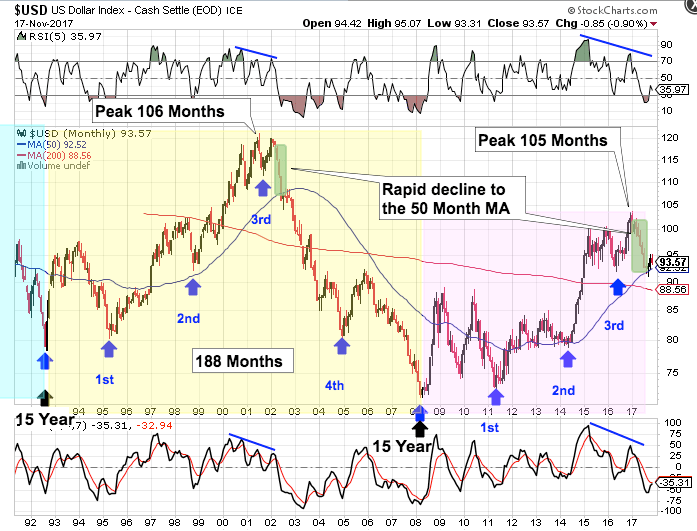
The dollar cycles through a 15 year super cycle. Each 15 year super cycle is embedded with five 3 year cycles. The dollar’s last 15 year super cycle peaked in 2001 on month 106, then declined into its third 3 year cycle low. The topping pattern in 2001 is vary similar to the current set up. The confirmation of a failed 3 year cycle confirms that the dollar has begun its 15 year super cycle decline. Once the dollar began its 15 year super cycle decline back in 2002 there was a rapid decline to the 50 month MA, as the dollar accomplished through September. The 50 month MA has provided support for the formation of a yearly cycle low. Once the new yearly cycle rolls over and the dollar loses the 50 month MA, that will confirm the bear market for the dollar.
May, 2016 hosted the 3 year cycle low, which was a shortened 3 year cycle of only 24 months. Since most times cycle balances themselves out, the dollar is positioned for the current 3 year cycle to be a stretched 3 year cycle to coincide with the start of the 15 year super cycle decline. And a stretched 3 year dollar cycle decline aligns with gold beginning a new multi year bull cycle.
Stocks
After peaking on day 54 stocks broke lower, printing their lowest point on Wednesday. At 60 days, that places stocks late in their timing band for a daily cycle low.
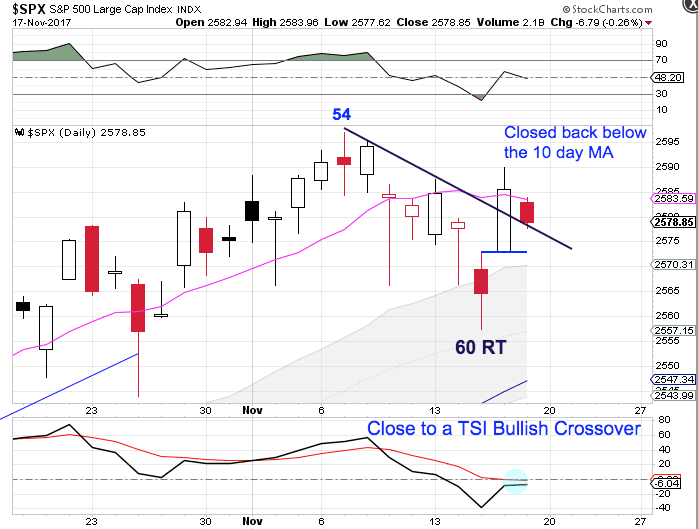
Stocks formed a swing low on Thursday that broke above the declining trend line and closed above the 10 day MA to signal that day 60 was the daily cycle low.
We need to keep in mind that stocks printed a large SOS number on Thursday. The 701 million selling on strength is the type of number that will be printed prior to an intermediate cycle decline. It is certainly not the type of number the we typically see as stocks emerge from a daily cycle low. Stocks followed that up by closing back below the 10 day MA on Friday. The take away here is there is uncertainty of whether or not stocks still have more to correct or if stocks are preparing to form a left translated daily cycle. But for now, Stocks continue to close above the upper daily cycle band indicating that they are in a daily uptrend. Stocks will remain in their daily uptrend unless they close below the lower daily cycle band.
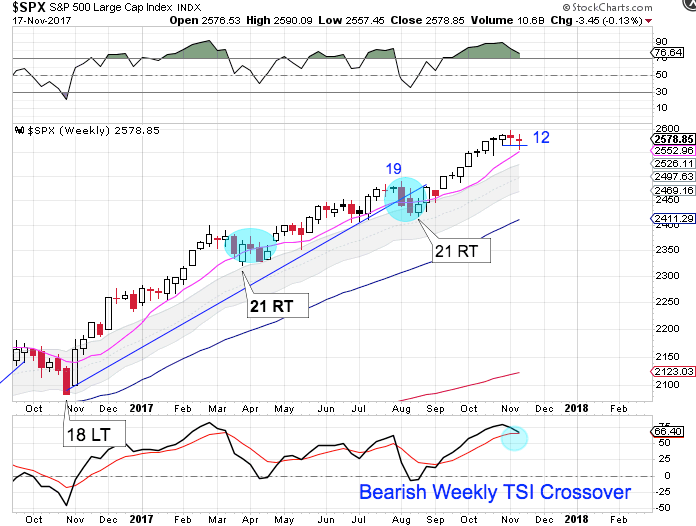
The decline into the day 60 DCL has caused stocks to print a weekly swing high and back test the 10 week MA. Once a weekly swing low forms then we can construct the weekly cycle trend line. Stocks are in a weekly uptrend. They will remain in their weekly uptrend unless they close below the lower weekly cycle band.
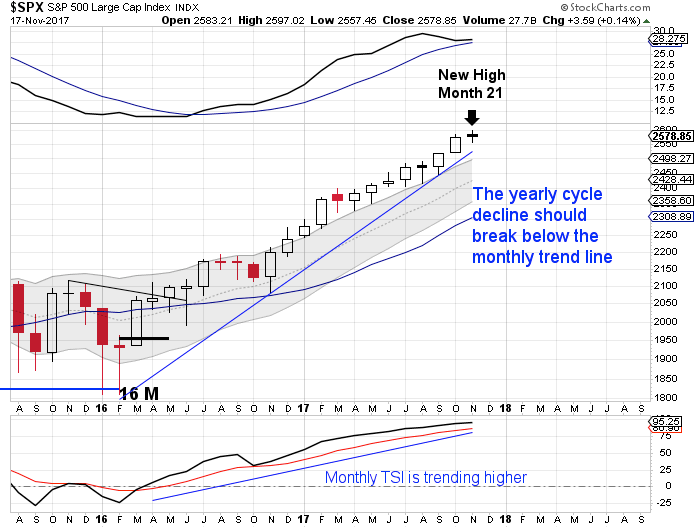
Stocks continued higher breaking out to new high in November, month 21. Stocks are deep in their timing band for seeking out their yearly cycle low. Since a yearly cycle low needs to occur at an intermediate cycle low, the earliest a yearly cycle low can form would be at the next intermediate cycle low. This means that the yearly cycle will extend by another 3 - 6 months.
Author

LikesMoney
Independent Analyst
Assets (such as stocks, gold, and the dollar) have identifiable cycles.


