Week 29 Market Roundup – Rotation from Nasdaq into Dow, Russell 2000 and SP500 [Video]
![Week 29 Market Roundup – Rotation from Nasdaq into Dow, Russell 2000 and SP500 [Video]](https://editorial.fxstreet.com/images/Markets/Equities/Nasdaq/nasdaq-amp-amex-16260859_XtraLarge.jpg)
“Watch out for NASDAQ climatic run up” as mentioned in my Week 28 market roundup, subsequently we have seen correction right on the Monday’s key reversal bar with the price spread of more than 4% with spike of supply signature. Refer the chart below for a comparison of Week 28 NASDAQ vs Week 29 NASDAQ.
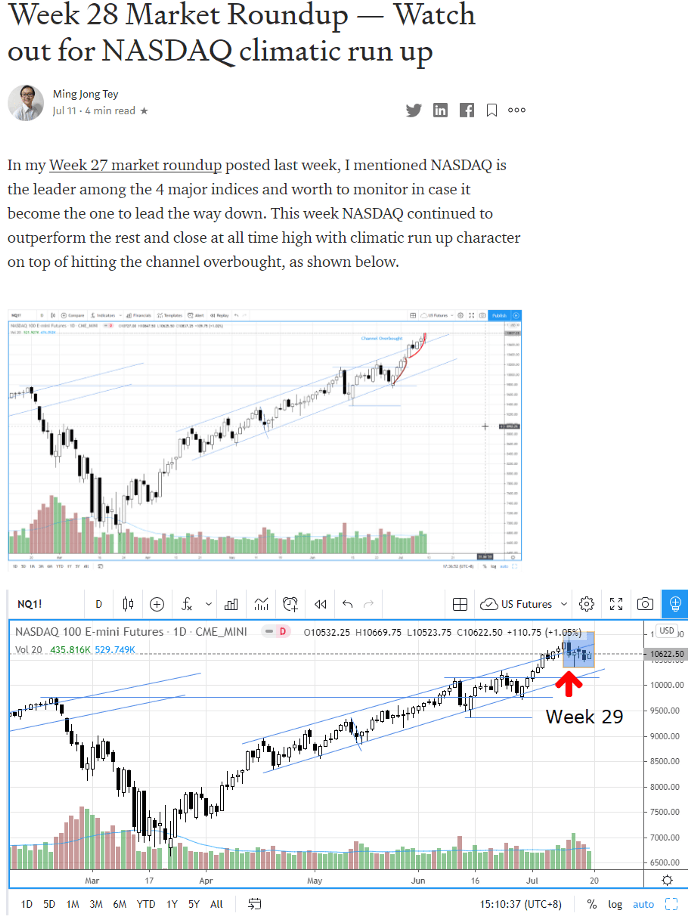
The important question here is are we in a market top yet?
If you follow my daily market analysis video series, you probably remember I pay attention to NASDAQ in case this leader will be the one to lead the market on the way down.
So, what happen to the DOW, S&P 500 and the RUSSELL 2000? Let’s take a look below the 4 indices for a comparison.
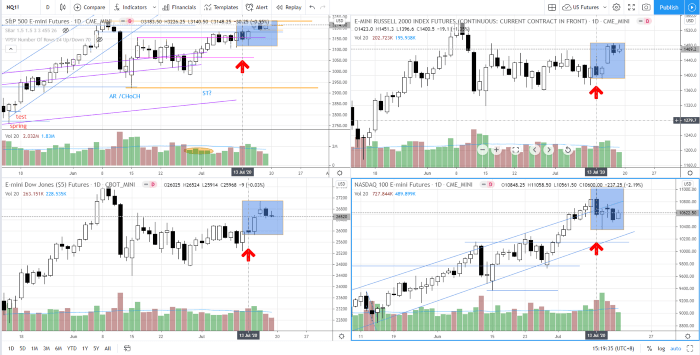
As we can see that NASDAQ (the bottom right) has been a laggard compared to the other 3 indices in the past 4 trading session, with increasing volume. This could suggest profit taking from NASDAQ after significant out-performance since the bottom formed in Mar 2020. Fund rotation out from the NASDAQ seems to be deployed into RUSSELL 2000, DOW and the S&P 500, as reflected in the stronger structure highlighted in the blue box.
While profit taking is on-going for NASDAQ, I expect out performance for the other 3 indices before a meaningful correction set in, which we will get it eventually.
Check out last week market analysis video series below if you haven’t or would like to reflect how last week unfold together with your preparation and analysis:
Stock Watchlist — Malaysia
FGV has started the rally last week with immediate target at 1.23. Supply has come in as reflected in the rejection tail with the spike of volume.
MASTER and ANNJOO are pending aggressive demand to kick start a rally.
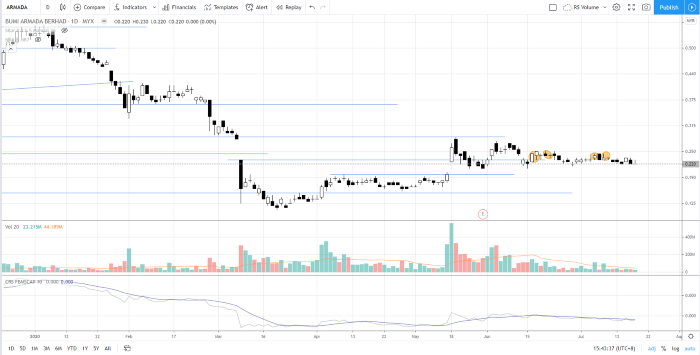
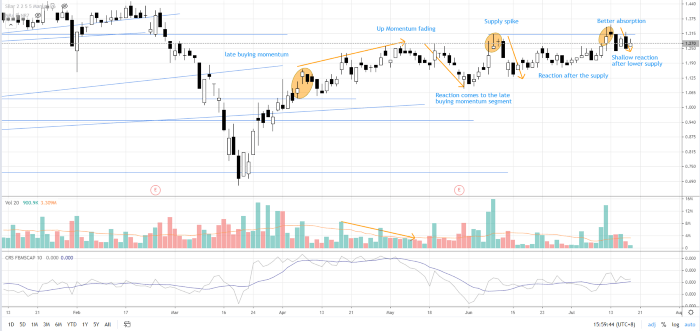
For ARMADA, I will stay cautious as supply absorbed the demand as circled in gold below, suggested hidden selling. A break above 0.25 is essential for a bullish case. Else, it will break below 0.21 with capitulation.
Similarly for KNM, supply was present from 0.22–0.25. For the bullish case to be valid, we will need to see a break and commit above 0.25. Else, we should see capitulation below 0.2.
For AIRASIA, no commitment above 0.8 suggests bearish outlook. A break below 0.7 will confirm the case. More development is required to confirm the case.
NAIM — supply showed up on Mon, Wed and Fri. Currently near the demand line of the channel, which could provide some support. It is still in the bull camp when it is above 0.86.
VS — it broke out last week and hitting my intermediate target between 1.2–1.3. Currently hitting the overbought channel. Supply absorption is required for the stock to go up.
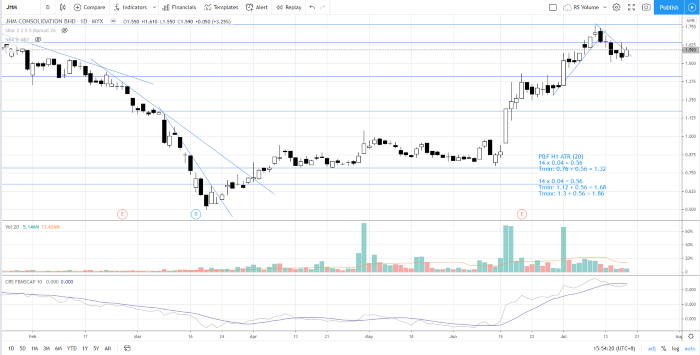
Stock A, as mentioned in Week 28, is JHM. Supply has been decreasing in the pullback last week. It should attempt to test the all time high at 1.77.
Stock B, a tech stock tapping on the growth of e-commerce, showed better supply absorption as annotated in the chart below. The timing could be ripe to breakout above 1.32 soon.
Stock Watchlist — US
MSFT (MICROSOFT) started the reaction mode in tandem with the NASDAQ correction. 198–202 is the support area to pay attention to.
FB (FACEBOOK)— it only had minor reaction and still flirting at the resistance level at 242 without giving up yet. It is trading within 230–250. It is stronger than the NASDAQ market.
IBB — broke all time high after back up action.
SE (SEA Limited) — started the reaction in tandem with the NASDAQ correction. A change of character has shown up. 100 is the first level of defense.
JD.com — started the reaction last week. Yet it is stronger than the NASDAQ market. It bounced up at the support level at 60.
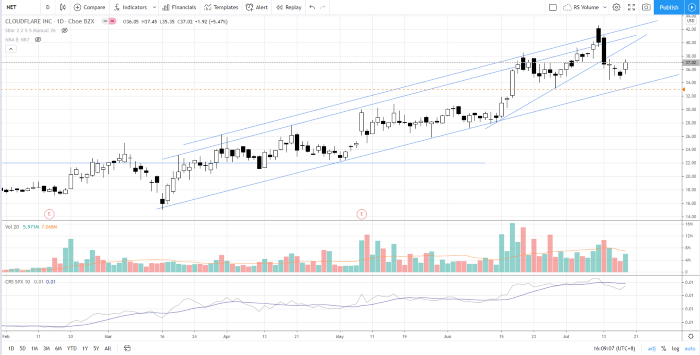
Stock X, as mentioned in Week 28 market roundup, is NET (CLOUDFLARE). After hitting overbought of the channel, it started a reaction in tandem with the NASDAQ market. More time is required for supply absorption before resuming to rally up.
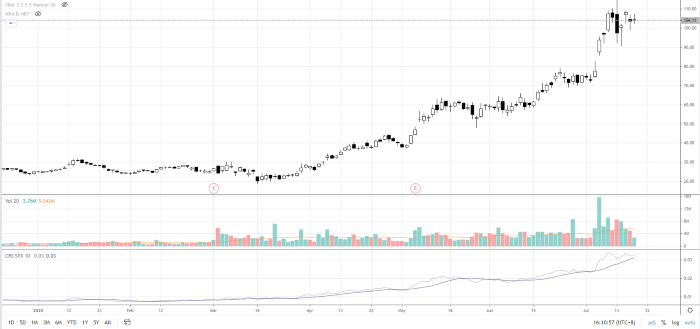
Stock Y, another high beta stock (from 20–100 since Mar 2020) from NASDAQ, is showing out performance during last week NASDAQ reaction.
Study their charts and you should find them interesting in terms of price structure and volume signature.
Author

Ming Jong Tey
Independent Analyst
Ming Jong Tey has been trading since 2008. He started his learning journey from technical analysis (indicators, Fibonacci, etc...) to value investing. Throughout his journey, he develops an interest in price action with chart pattern trading.


