Watch the US dollar as election day approaches

Investors are right to be cautious about the long list of variables that could shift market sentiment at a moment’s notice heading into the fourth quarter of a wild year. With the president and first lady testing positive for the novel virus that has rocked our world economy, we are sure to see yet another wave of drama in the mainstream media. Many investors may feel like they are drowning in news, with conflicting narratives coming from all angles which could impact their investment decisions for better or worse.
Perhaps the best way one could simplify things amid such chaos is to watch the US Dollar. A sharp move up in the Dollar would be perhaps the most telling signal that markets are heading for another deflationary shock - as we saw in March this year.
Since the onset of the pandemic in 2020, the US Dollar’s strength or weakness has driven the most consequential market movements. Watching for volatility in the dollar currency pairings and DXY could help investors get in front of a sudden deflationary shock and provide the early signal.
Here are some important US Dollar correlations to be aware of in Q4:
- “Dollar up” = deflation and less liquidity in markets (risk-off).
- “Dollar down” = inflation and more liquidity to boost risk sentiment.
- Based on the first two observations, investors can either position themselves cautiously for a wave of deflation, or try and capitalize on inflation assets rising. In a general sense, observing the two scenarios above can help to cut through the overwhelming amount of narratives in the news today.
- The US Dollar and gold have been following their age-old negative correlation closely. On days when gold has risen sharply, the dollar has either been muted or down. The opposite was true when the Dollar made its run-up in March. Of course, fundamentals overwhelming support gold during these times of currency devaluation and uncertainty.
- On “Dollar down” days, it can mistakenly seem like risk-on sentiment is so strong that everything seems to rise. However, this is just because the currency in which financial assets are denominated is being devalued by printing from the central bank.
- In a “Dollar up” scenario, it is very unlikely that emerging market assets would perform well. “Dollar up” has recently been a sign that liquidity is scarce, and large investors are rushing to safe havens. Therefore, investors should be cautious when it comes to EM currencies and other assets if the Dollar catches a wave of buyers.
We can logically conclude that heading into this extremely uncertain period, long investors should be cautious if they observe a spike in the US Dollar. A rush into cash as margin calls need to be met can create a self-reinforcing deflationary dilemma - a situation where institutions and traders are selling because they have to, not because they want to.
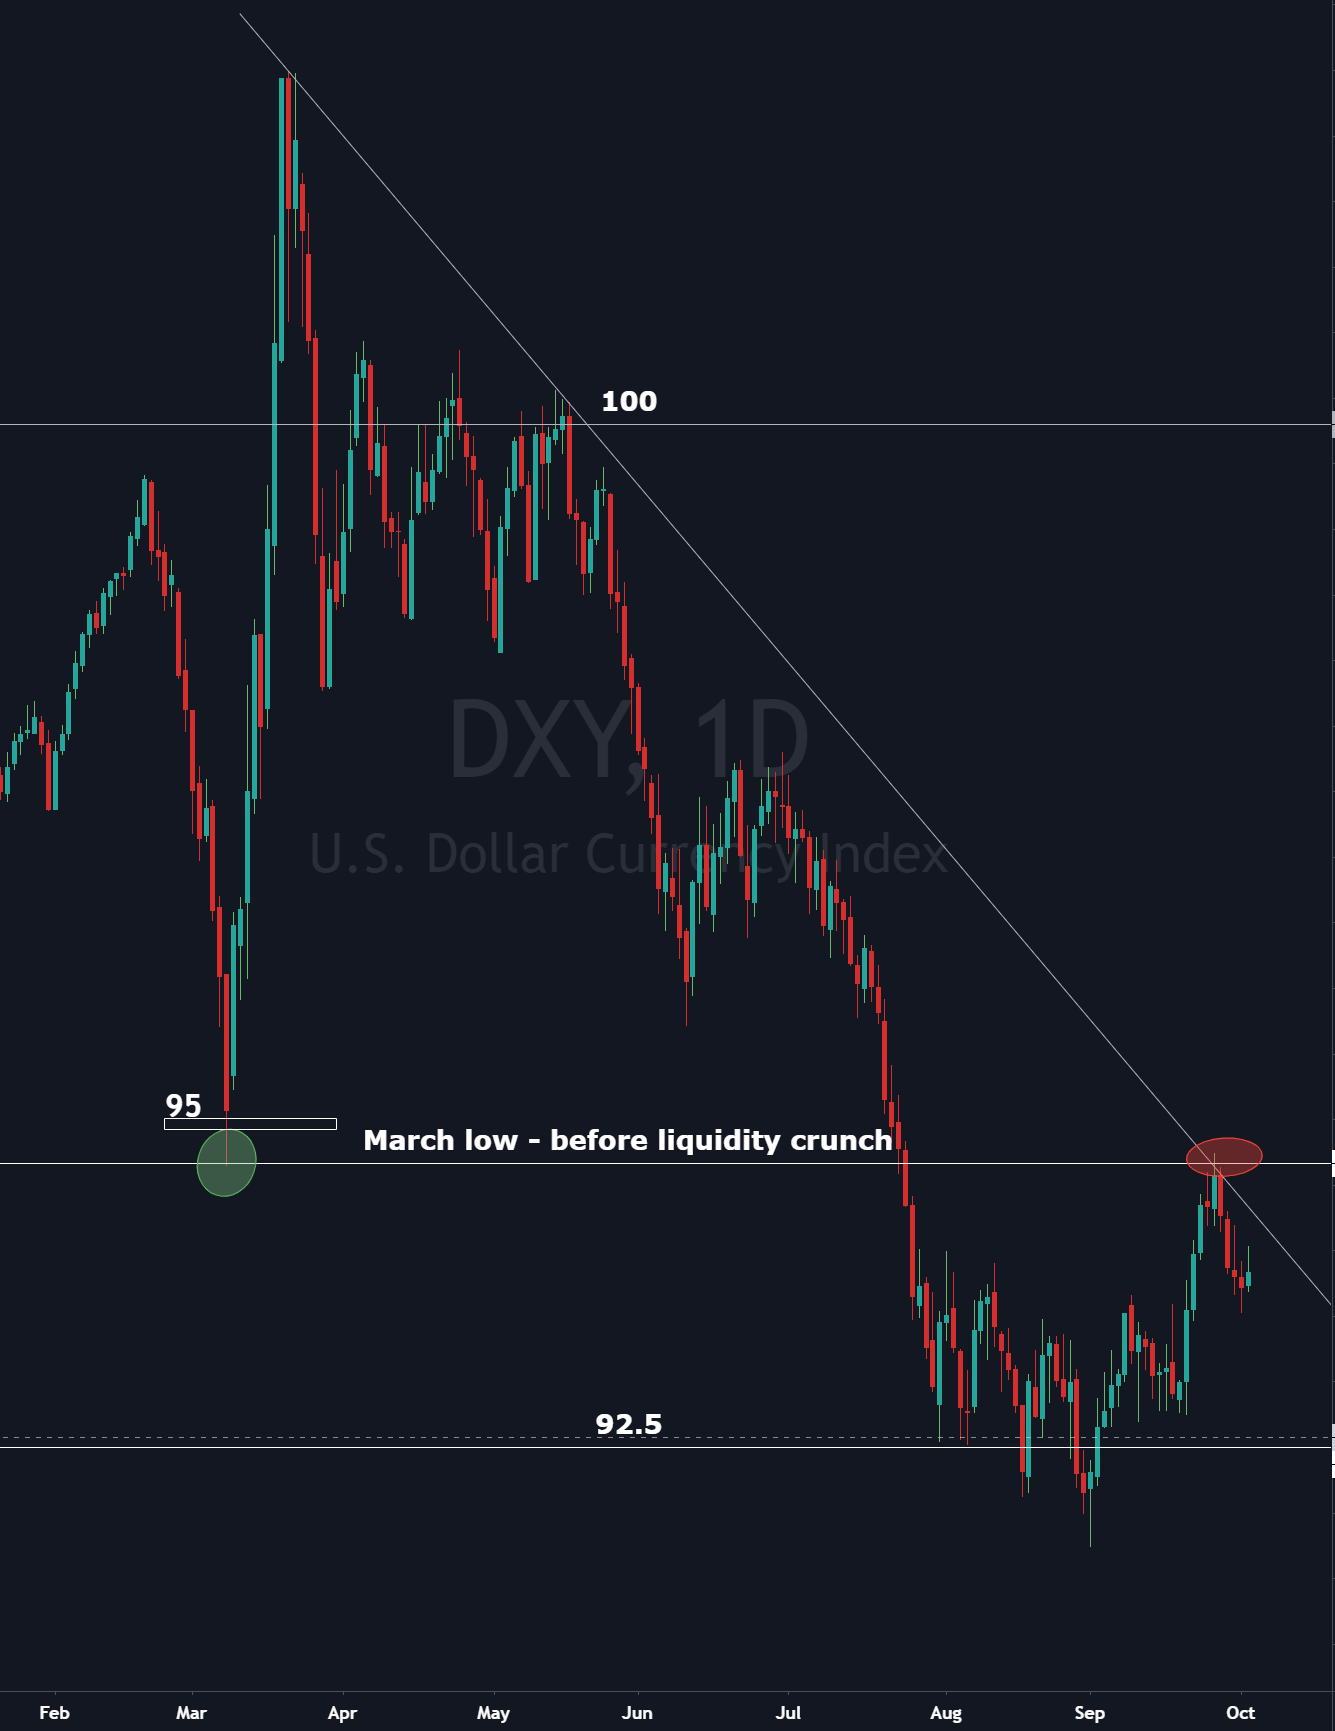
Key Levels for the Dollar: DXY Daily Chart
See the chart below,
- The US Dollar has failed to make a bullish breakout from the bearish trendline measured from the highs in March (solid white in the chart). These highs were printed during the liquidity crunch at the height of market panic.
- If the DXY breaks out of the trendline in a bullish manner, we can expect more upside to follow.
- If the DXY closes below the structure in the 92.5 zone , this would support any inflation assets like commodities and gold, as well as growth stocks.
- For now, there seems to be a tug of war going on with an edge being maintained by Dollar bears. The previous
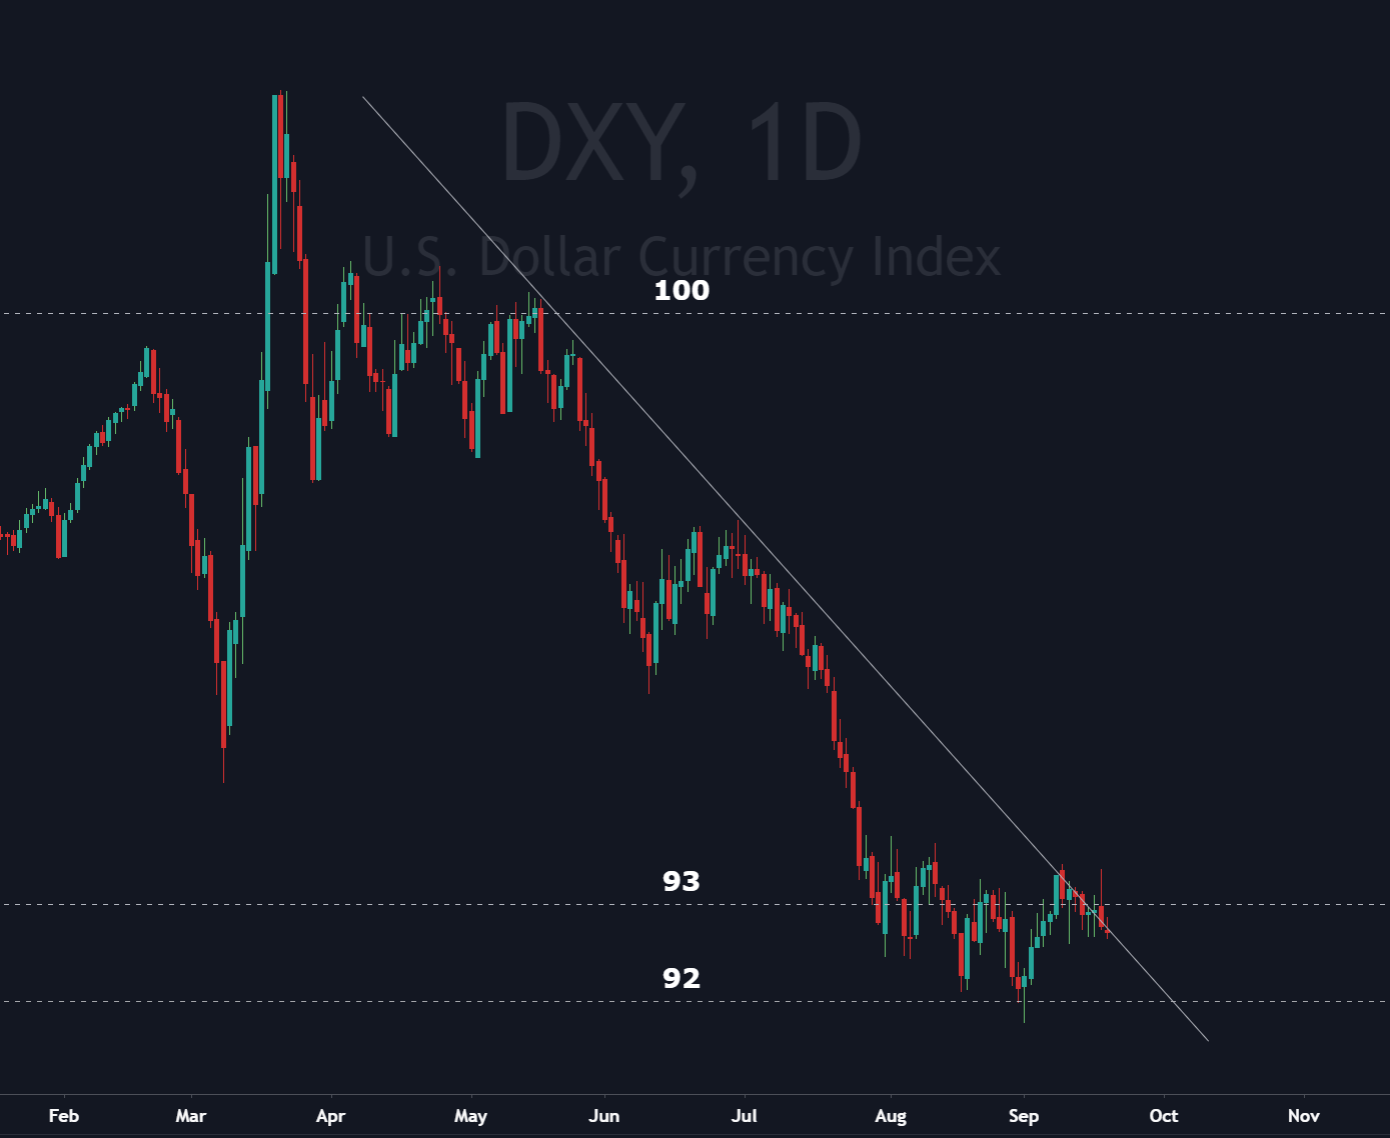
- The second chart below: bulls should be reminded that there remains another logical support level below, the 89-90 range on the DXY. This would be a fair spot for the Dollar to find support if the recent bullish price action cannot be sustained. At least another 4% drop would be needed, quite possibly helping risk assets make a test of their highs again
Author

Miles Ruttan
Bytown Capital
Miles' focus at the firm is to oversee our macro analysis, with the emphasis being placed on global credit and liquidity flows.


