USD/JPY Weekly Forecast: Overbought conditions could threaten the parabolic rise
- USD/JPY recorded the third straight weekly gain.
- The rally in Treasury yields served as the key catalyst.
- Overbought conditions on the daily chart warrant caution.

The rally in USD/JPY that kicked-off from around 105.00 gained further momentum over the last week, in what markets witnessed a parabolic rise. The major settled Friday near 108.35, gaining almost 200-pips or 1.65% on a weekly basis. The pair hit the highest levels in 12 months on Friday at 108.64 before easing slightly into the weekly closing.
USD/JPY’s upsurge was mainly powered by the resumption of the sell-off in the US Treasuries in the second half of the week, which refueled the advance in the Treasury yields and US dollar.
USD/JPY: An impressive week – in the hindsight
In the early part of the week, the spot saw a bit of a corrective pullback as the bulls took a breather along with the Treasury yields, despite stronger-than-expected US ISM Manufacturing PMI. Markets turned cautious amid fears of overheating of the economy ahead of the Fed Chair Jerome’s speech on Thursday. Investors moved on the sidelines, anticipating hawkish comments from the Fed Chief, in light of the recent disruptions in the bond markets.
However, Powell sent a dovish message and dismissed the bond market jitters in his Wall Street Journal Interview, reigniting the reflation trade-backed surge in Treasury yields across the curve. Powell said that the central bank remains focused on achieving its dual mandate of full employment and at least a 2% inflation level. He said recent bond jitters "caught my attention”, although added that they would be concerned "by a persistent tightening of financial conditions broadly." The benchmark 10-year US rates recaptured the 1.50% level and offered a fresh boost to the US dollar, as the major tested the 108 level.
It was on Friday that USD/JPY stormed through the latter and refreshed yearly highs beyond 108.50, courtesy of stellar US NFP numbers, which rose by a whopping 379K in February, beating the market consensus of 182K. Encouraging employment data confirmed the view about the strengthening economic recovery, adding credence to the ongoing surge in the yields while the US dollar index rose above 92.00, the highest levels since November 2020.
Week ahead
The USD/JPY pair is likely to hold onto the recent advance although additional upside appears limited. A lack of significant macroeconomic drivers on the US docket, at the start of the week, could leave the major at the mercy of the risk dynamics and action in the bond markets.
However, from the Japanese calendar, the final revision to the fourth-quarter GDP could offer some trading incentives, as the country’s most prefectures call for bringing an end to the state of emergency. The world's third-largest economy shrank 4.8 percent last year, its first annual contraction since 2009 at the peak of the global financial crisis (GFC).
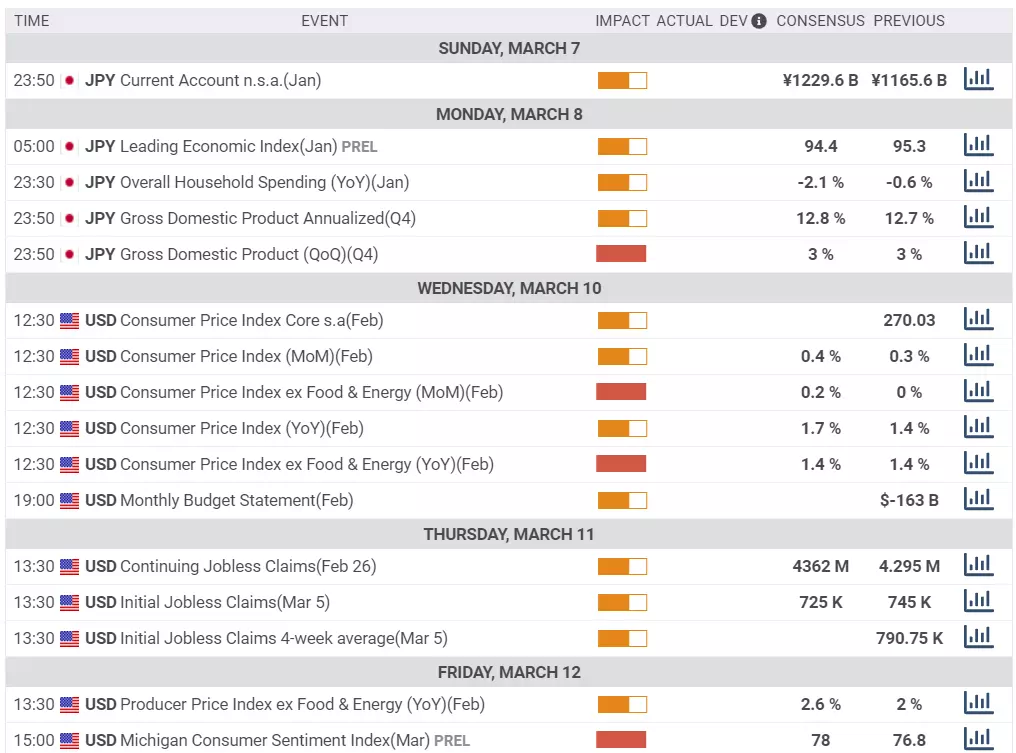
It’s a black-out period for the Fed and hence nothing on that front too but the US stimulus news will be closely followed ahead of Wednesday’s US Consumer Price Index (CPI) release for February. The headline US CPI is expected to rise 0.4% MoM in Feb vs. 0.3% previous while the monthly core figure is foreseen at 0.2%. On an annualized basis, the CPI is expected to accelerate by 1.7% in Feb when compared to +1.4% booked in January.
Meanwhile, Thursday’s US weekly unemployment claims data will draw some attention ahead of Friday’s Preliminary Michigan Consumer Sentiment Index, which is seen higher at 78.0 in March vs. 76.8 prior.
USD/JPY: Technical outlook
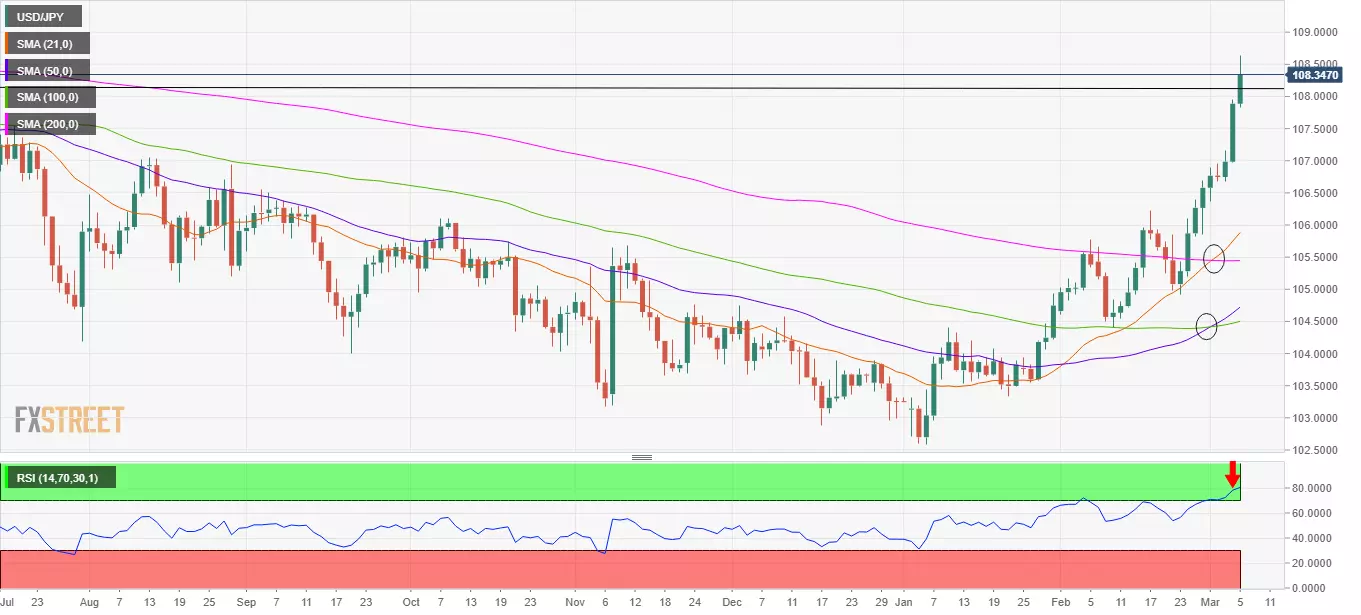
Looking at USD/JPY’s daily chart, the double bull cross confirmed on March 1 emboldened the bulls, which propelled the rates to multi-month highs.
USD/JPY: Daily chart
The 50-day simple moving average (DMA) crossed the 100-day DMA from below on Monday and at the same time, the 21-DMA also pierced through the 200-DMA, making a sure shot case for the bulls.
Although the 14-day Relative Strength Index (RSI) indicates heavily overbought conditions, as it closed the week at 79.20 levels. This suggests that the pair could see a corrective decline in the coming week before resuming the uptrend.
Any retracement below the 108 level could call for a test of the March 4 low at 106.96.
-637506099597147939.png)
USD/JPY: Weekly chart
Meanwhile, if the buying interest remains stronger, a test of the 200-weekly moving average (WMA) at 109.04 could be challenged.
Acceptance above that level is critical for additional upside towards the June 2020 highs of 109.85.
Author

Dhwani Mehta
FXStreet
Residing in Mumbai (India), Dhwani is a Senior Analyst and Manager of the Asian session at FXStreet. She has over 10 years of experience in analyzing and covering the global financial markets, with specialization in Forex and commodities markets.
















