USD/JPY Forecast: Holding on to gains, 109.00 key

USD/JPY Current Price: 109.21
- US-China trade-related headlines keep leading the way for markets.
- Japanese data at the start of the week expected to show some improvement.
- USD/JPY technically skewed to the upside but depending on sentiment.
The USD/JPY pair has finished Friday with modest losses, but firmly up for the week at around 109.20. The pair lost momentum in the last American session, following headlines indicating that US President Trump didn’t make up his mind yet on removing tariffs should he reach a trade deal with China. The pair fell to 109.07 with the news, but market’ players shrugged off pretty fast the negative news, with high-yielding equities recovering in detriment of the safe-haven yen. Weekend news may spur demand for safety, although buyers are aligned around 109.00.
US indexes closed the week with gains and not far from the all-time highs achieved this week, while US Treasury yields extended their advances. The yield on the benchmark 10-year Treasury note closed at 1.94% a level last seen in July.
Early Monday, Japan will release September Trade Balance and Machinery Orders, while the BOJ will publish the Summary of Opinions. The country will also release the October Eco Watchers Survey, with sentiment seen rebounding from the previous monthly readings.
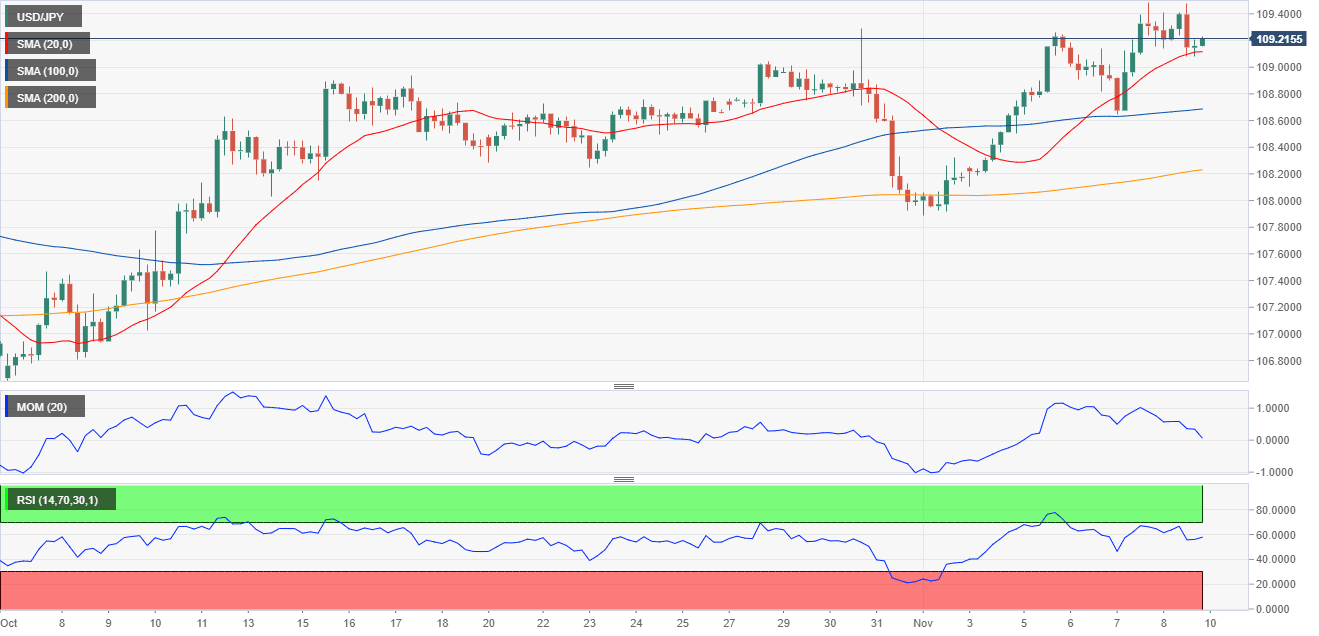
USD/JPY short-term technical outlook
The daily chart for the USD/JPY pair shows that it settled above all of its moving averages, after meeting buyers around the closest one, a flat 200 DMA. The 20 DMA maintains its bullish slope below it, while technical indicators have lost strength upward, but remain within positive levels. In the 4-hour chart, the pair offers a neutral-to-bullish stance, as technical indicators lack directional strength but remain within positive levels, while the pair has held above all of its moving averages, although the 20 SMA has begun to lose its bullish strength.
Support levels: 109.00 108.65 108.40
Resistance levels: 109.30 109.60 110.00
Author

Valeria Bednarik
FXStreet
Valeria Bednarik was born and lives in Buenos Aires, Argentina. Her passion for math and numbers pushed her into studying economics in her younger years.


