Dow Jones final wedge plus EUR/USD and Bitcoin
-
The financial markets are heading towards a climax. The EUR/USD, BTC/USD and US30 daily charts are reaching a final decision moment.
-
The US30 (DJI) daily chart remains in an uptrend. But the higher highs are showing lower momentum. The uptrend seems to be running out of steam.
-
The EUR/USD remains in the bear flag chart pattern. Price action remains below the critical 50% Fibonacci retracement resistance level.

Bitcoin shows five wave down
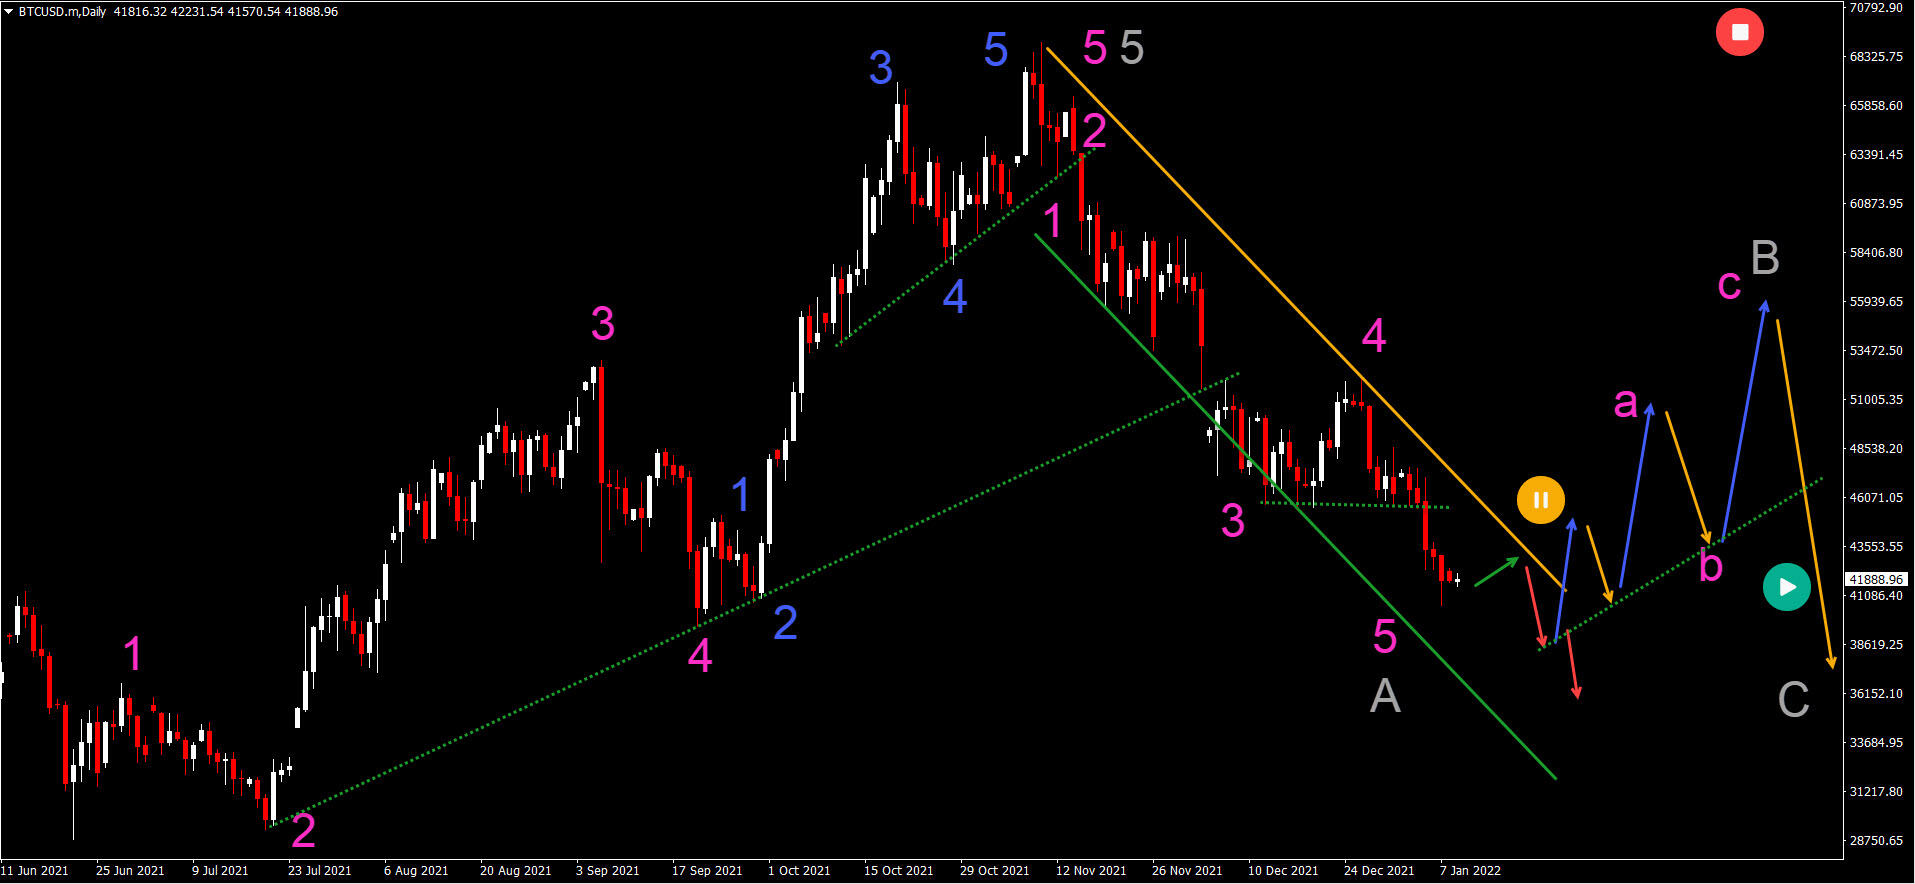
The BTC/USD (Bitcoin vs US Dollar) daily chart has broken below the key support trend lines (dotted green):
-
The bears have been moving lower in a neat downtrend channel (orange lines).
-
The price action has been clearly impulsive and is showing a 5 wave pattern (pink). This is probably part of a larger wave A (grey) of an ABC pattern (grey).
-
Another push lower could occur within the wave A (grey). A break above the channel indicates the end of the wave A (grey) and the start of an ABC pattern within wave B (grey).
-
An ABC (pink) rally (green arrows) up into resistance is then expected before price turns around and retraces downward again in a wave C (grey).
EUR/USD remains stuck in bear flag
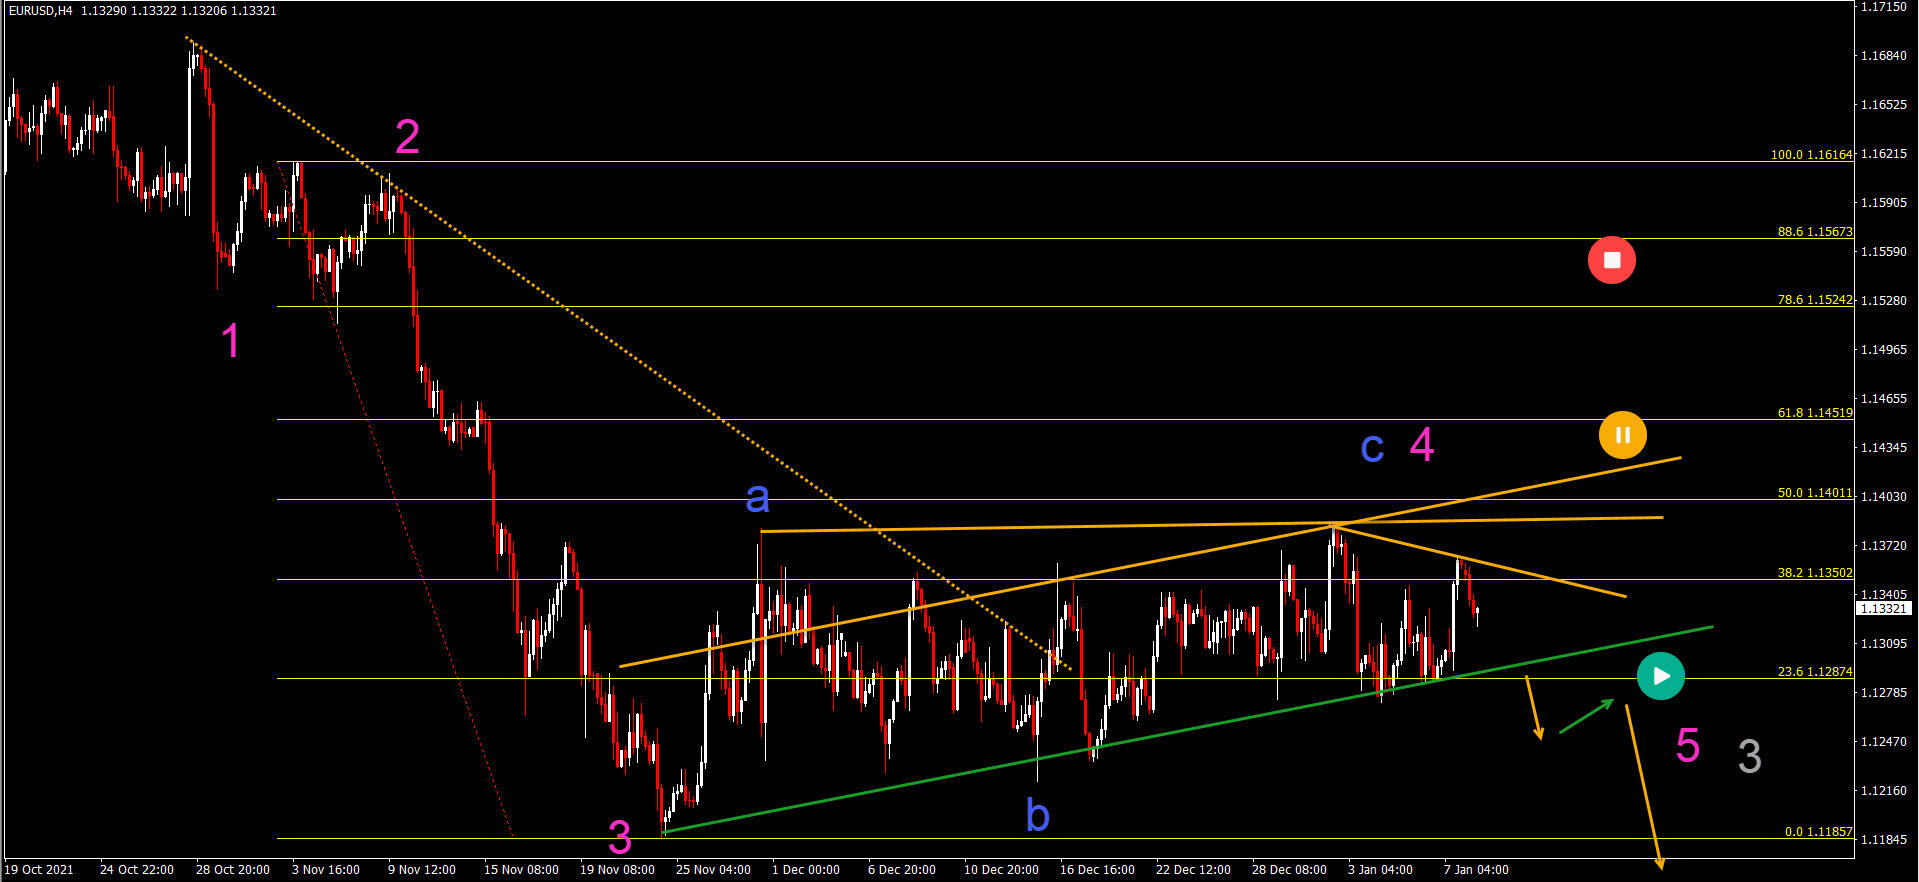
The EUR/USD remains in the bear flag chart pattern. Price action remains below the critical 50% Fibonacci retracement resistance level and in between the support line (green) and resistance line (orange):
-
The EUR/USD remains in the bear flag as long as price action stays below the 50% Fibonacci level. A break above it places the bearish analysis on hold (orange pauze circle). A deep push up invalidates (red circle) the wave 4 (pink).
-
A breakout below the support trend line (green) should confirm the downtrend continuation towards the next round level at 1.10.
US30 ending diagonal?
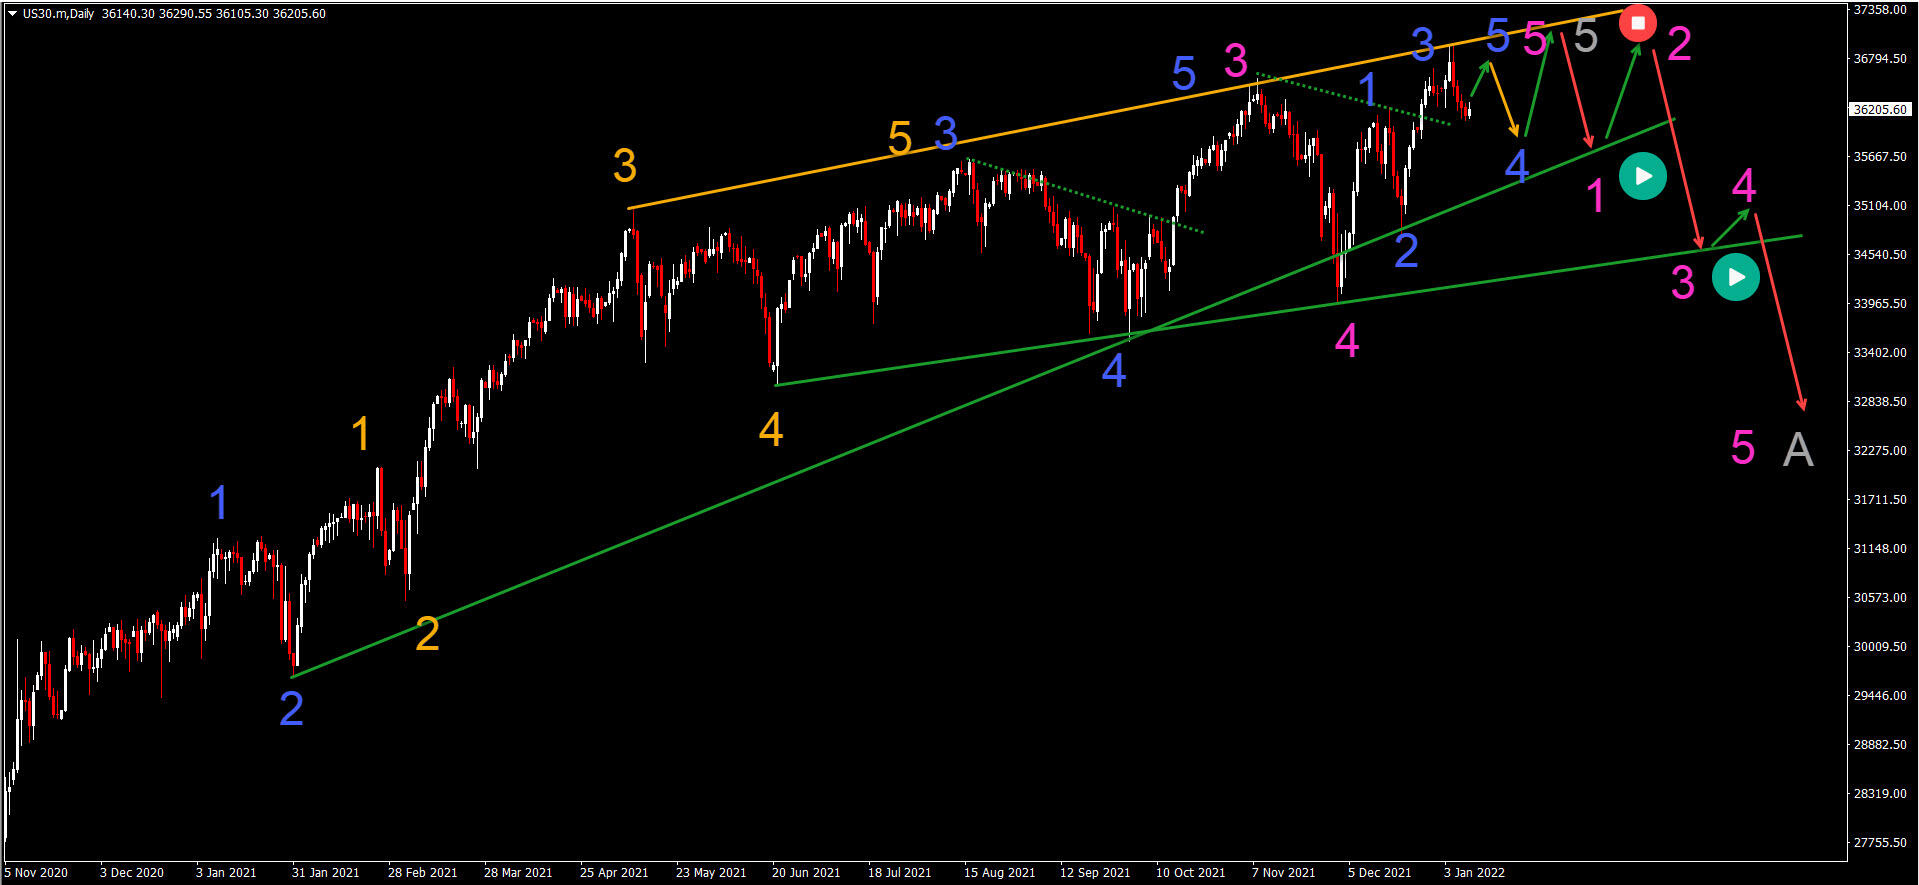
The US30 (DJI) daily chart remains in an uptrend. But the higher highs are showing lower momentum. The uptrend seems to be running out of steam:
-
The weaker higher highs indicate a potential rising wedge reversal chart pattern. The uptrend is still alive but certainly weaker. The Elliott Wave patterns suggest a final wave 5 (grey).
-
Within the wave 5 (pink), there seems to be an ending diagonal pattern (blue wave 5). The wave 3 (blue) is shorter than wave 1 (blue) and wave 5 (blue) should be the shortest.
-
If price action respects the resistance trend line (orange), then a head and shoulders pattern followed a by strong move lower (red arrows) should confirm a bearish retracement or reversal.
The analysis has been done with the indicators and template from the SWAT method simple wave analysis and trading. For more daily technical and wave analysis and updates, sign-up to our newsletter
Author

Chris Svorcik
FS method
Chris Svorcik is a trader, analyst, and educator with over 15 years of experience in financial markets, specializing in moving averages, market structure, and price patterns.


