US stock market plunge: is this just the start?

For the first time in over five months, US stock indices suffered losses of one per cent or more in a single session. Some said it was the end of the so called “Trumpflation” trade, some blamed crude oil and others cited a combination of these and other factors. Whatever the reason, it was a sizeable move. The signs were all there. Safe haven gold and Japanese yen had been rising since December. The Dow Jones Transportation Index, which is deemed by many as a leading indicator for the stock markets, had been falling for weeks. The key question now is what will happen next. The sell-off could easily last several days and this may well turn out to be a long-term top for the markets. Or it could just be a pause before we see another rally into new all-time highs. The truth is, no one knows what's next for the markets. But the early signs are not great. In fact, far from it.
Seasonal tendencies point to correction
For a start, there's the seasonality factor. The US stock markets tend to perform well in the fourth quarter leading up to the Santa rally in late December. The positively tends to carry on well into the first quarter, as we have seen. But towards the end of Q1 and start of Q2, things tend to change for the worse. Thus, given the seasonal tendencies of the US stock markets, one should be expecting a stock market correction around this time of the year, especially after such a strong performance in Q4 and most of Q1. I imagine that institutional-level investors, hedge funds and other large market participants are aware of this seasonality factors of the markets, so it could be that they are now banking profit on their long positions accumulated during the previous months, quarters or even years.
Rising interest rates bode ill for stocks
But there is something big happening on a macro level. Up until recently, global monetary conditions have been extraordinary loose because growth was weak, unemployment was high and inflation was non-existent. However, in recent months inflationary pressures have risen sharply, due in part to years of low and negative interest rates in some parts of the world. Consequently, central banks have started to drop their dovish stances. Some have turned neutral while others have turned hawkish. The US Federal Reserve has even started to tighten its belt by raising interest rates to a target of 0.75-1.00 per cent. Others might join the Fed soon – the Bank of England, for one, because of the surprisingly strong rise in U.K. Inflation, due in part to a weaker currency as a result of Brexit concerns. The European Central Bank could be next. The Bank of Japan has hinted that there won't be further QE expansion coming up any time soon.
So, you get the picture: interest rates are on the rise. When interest rates rise, the opportunity cost of holding onto overvalued equities rise too, at least on a relative basis. After many years of basically money printing by central banks, combined with low rates of inflation, stocks were the obvious choice of investment for many. Now, that may no longer be the case. Fixed income, for example, might become attractive again as interest rates rise.
US stocks are overvalued
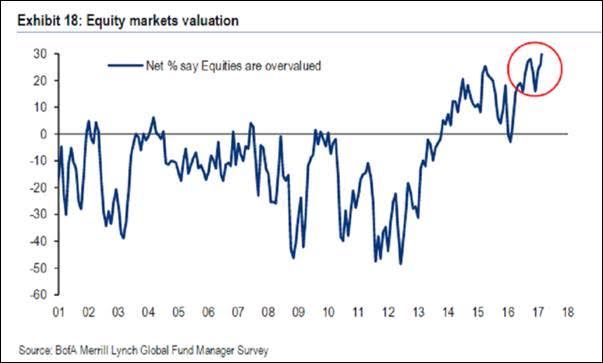
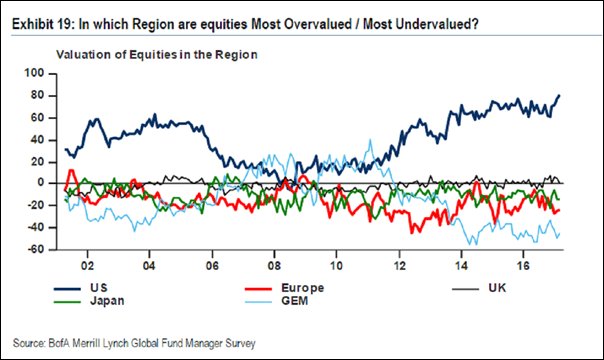
It is not just me who thinks market valuations are expense. In a Bloomberg article, I came across a survey that was carried out by Bank of America Merrill Lynch, asking fund managers what they thought about stock market valuations. Well, according to the survey, fund managers thought that stocks are the most overvalued they have been in nearly 20 years. The US stock market was identified as the most overvalued region, backed by 81% of respondents. Elsewhere, fund managers’ views were different, with emerging market and Eurozone equities being “undervalued.”
S&P suffers break in market structure: momentum with sellers
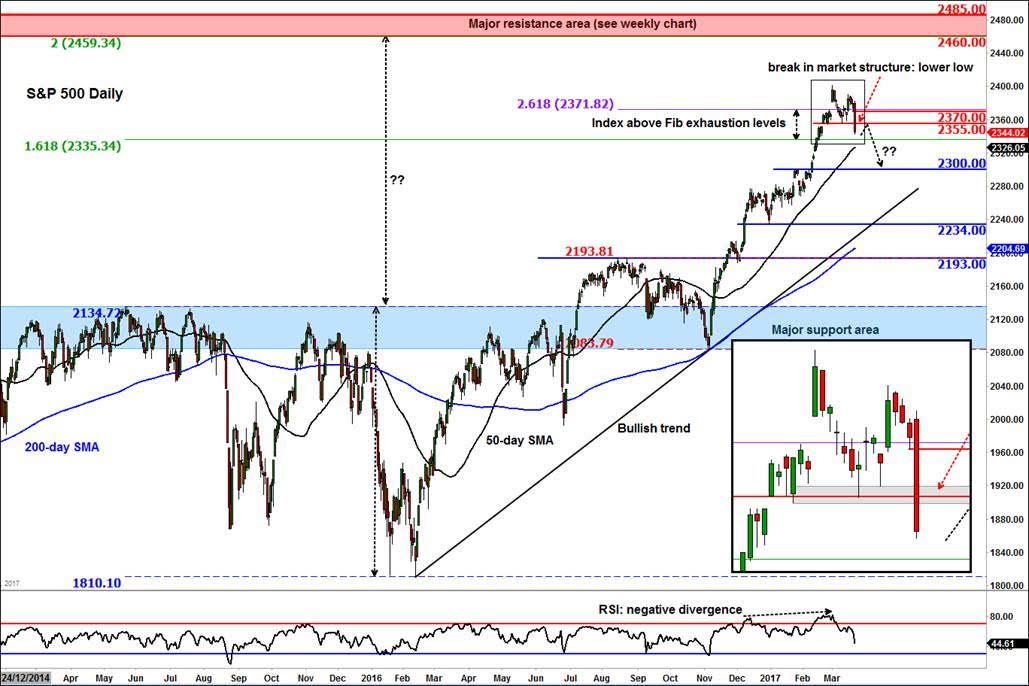
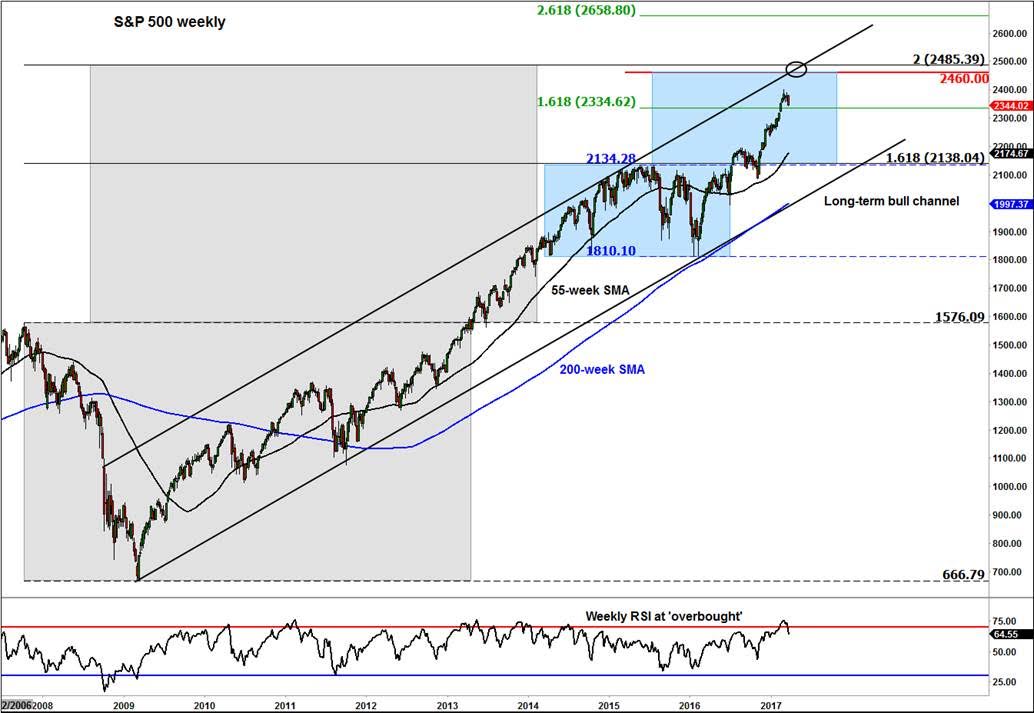
Prior to Tuesday’s sell-off, the S&P 500 had already reached extreme ‘overbought’ levels as indicated by the Relative Strength Index on both the daily and weekly time frames. Thus, at this stage one could view this as on overbought sell-off. That’s especially the case when you consider that the S&P had reached – and breached – key Fibonacci extension or exhaustion levels at 2335 and 2371 from two previous price swings (see the daily chart). But one has to wonder if this is the start of something really big and ugly? On the daily chart, one can observe a clear break in market structure. The las support around the 2355 area has given way. Thus a re-test of this level could be interesting to watch. If the sellers show up there then we could see further weakness in the days or possibly weeks to come. The first immediate key reference point is at 2300, which means the index could drop another 44 points before it potentially bounces. However if the 2355 is reclaimed by the bulls on a daily closing basis then this would weaken the bearish argument. If that’s the case, then we may see a bounce towards the last support pre breakdown at 2370. On the weekly, the S&P has failed to reach the top of the long-term bullish channel before turning. It may get there eventually, but given the RSI ‘overbought’ conditions, I cannot rule out the possibility of a drop to the support trend of the channel, which is miles away from here. Proceed with extra care, especially if bullish.
Author

Fawad Razaqzada
TradingCandles.com
Experience Fawad is an experienced analyst and economist having been involved in the financial markets since 2010 working for leading global FX, CFD and Spread Betting brokerages, most recently at FOREX.com and City Index.


