US 10yr yield, lots of long term resistance just above

Near term US 10 year note yield outlook:
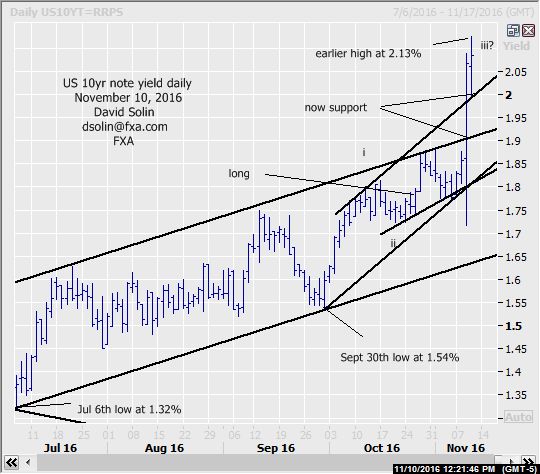
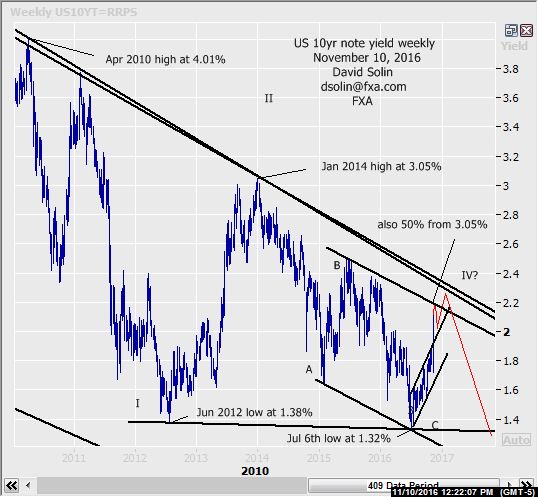
On the Nov 7th email, once again said there was still no confirmation of even a shorter term top "pattern-wise" and the market surged since (following the US election, had expected the further near term upside to be more limited). Though there is still no confirmation of a short term top "pattern-wise" (5 waves down on short term chart for example), the market is no doubt overbought after its recent surge and nearing longer term resistance at 2.19/23% (both the ceiling of the bearish channel from Jan 2015 and a 50% retracement from the Jun 2014 high at 3.05%, see weekly chart/2nd chart below), an "ideal" area to form a top for at least a week or 2. In the bigger picture, the upside pattern from at least the Sept 30th low at 1.54% is not "complete" (currently within wave iii, see numbering on daily chart below), suggests that this potential week or 2 of downside would be a correction (wave iv) and with at least marginal new highs after (within wave v, and potentially part of a more major topping, see longer term below). Nearby support is seen at the broken ceiling of the bullish channel from Sept 30th (also earlier low, currently at 1.97/99%) and the broken ceiling of the larger bullish channel from July (currently at 1.89/91%). Bottom line: still no confirm of even a short term top, but an overbought market and approach of longer term resistance at 2.19/23% argues a rising risk of at least a week or 2 of correcting.
Strategy/position:
Still long from the Oct 26th buy at 1.79% and for now would switch to a more aggressive stop on a close .02 back below the ceiling of the channel from Sept (to reflect the rising risk of a top). Note, sometimes better to be good than lucky as had not been expecting substantial further gains (at least not so immediately).
Long term outlook:
As discussed above, there is rising risk for a week or 2 of correcting and with a resumption of the upside after. But such action could be part of a more major topping over the next month or 2 as the market may be forming a huge falling wedge since Apr 2010. Though seen as reversal patterns, wedges break down into 5 legs and raises some scope for a final decline all the way back to the July low at 1.32% within that final leg (wave V, see "ideal" scenario in red on weekly chart/2nd chart below). Note too the 3 wave decline (A-B-C) from the Jan 2014 high at 3.05% to the July marginal low at 1.32%, argues a "complex" type pattern adding to the potential of that large wedge. At this point the confidence in this more major topping scenario is not extremely high as there is still no confirmation of even that short term peak (see shorter term above), while a clear break above the bearish trendline from April 2010/ceiling of the potential wedge (currently at 2.35/45%) would abort that wedge view, and argue longer term gains back toward the Jan 2014 high at 3.05%. Bottom line : some potential for a month or 2 of a broader ranging/important topping but the confidence is not yet very high.
Strategy/position:
With the confidence in that important peak not yet very high and scope for another month or 2 of a broader ranging, would be a bit more patient for a higher confidence entry.
Author

David Solin
FXA


