Upside bias = Upside day [Video]
![Upside bias = Upside day [Video]](https://editorial.fxstreet.com/images/Markets/Commodities/Metals/Gold/safe-investment-gm147322399-17568598_XtraLarge.jpg)
US Dollar: Sept USD is Up at 97.670.
Energies: Aug'20 Crude is Down at 39.11.
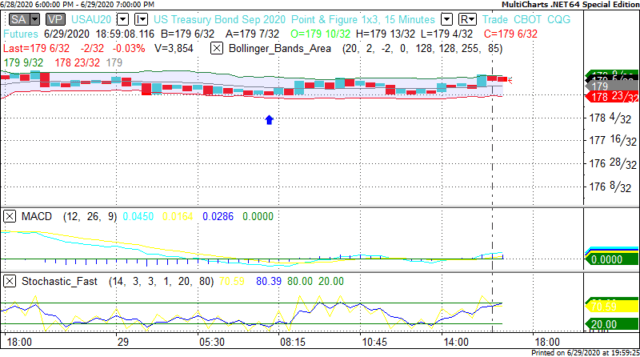
Financials: The Sept'20 30 year bond is Up 7 ticks and trading at 179.08.
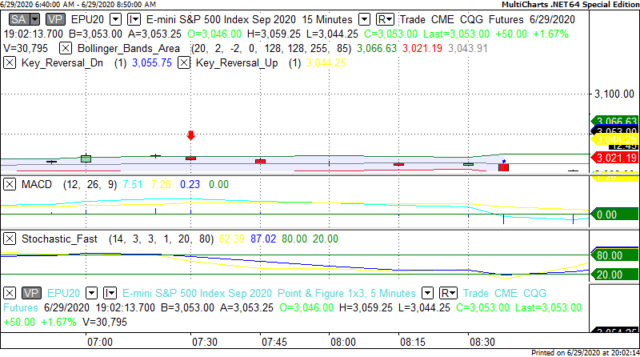
Indices: The Sept S&P 500 emini ES contract is 64 ticks Lower and trading at 3032.00.
Gold: The Aug'20 Gold contract is trading Up at 1782.70. Gold is 15 ticks Higher than its close.
Initial Conclusion
This is not a correlated market. The dollar is Up+ and Crude is Down- which is normal and the 30 year Bond is trading Higher. The Financials should always correlate with the US dollar such that if the dollar is lower then bonds should follow and vice-versa. The S&P is Lower and Crude is trading Lower which is not correlated. Gold is trading Higher which is not correlated with the US dollar trading Up. I tend to believe that Gold has an inverse relationship with the US Dollar as when the US Dollar is down, Gold tends to rise in value and vice-versa. Think of it as a seesaw, when one is up the other should be down. I point this out to you to make you aware that when we don't have a correlated market, it means something is wrong. As traders you need to be aware of this and proceed with your eyes wide open.
At this time Asia is trading mainly Higher with the exception of the Indian Sensex exchange which is Lower at this time. Currently all of Europe is trading Lower.
Possible Challenges To Traders Today:
-
S&P/CS Composite-20 HPI is out at 9 AM EST. This is Major.
-
Chicago PMI is out at 9:45 AM EST. This is Major.
-
CB Consumer Confidence is out at 10 AM EST. This is Major.
-
FOMC Member Williams Speaks at 11 AM EST. This is Major.
-
FOMC Member Brainard Speaks at 11:05 AM EST. This is Major.
-
Fed Chair Powell Testifies at 12:30 AM EST. This is Major.
-
FOMC Member Kashkari Speaks at 2 PM EST. This is Major.
Treasuries
We've elected to switch gears a bit and show correlation between the 30 year bond (ZB) and The S&P futures contract. The S&P contract is the Standard and Poor's and the purpose is to show reverse correlation between the two instruments. Remember it's liken to a seesaw, when up goes up the other should go down and vice versa.
Yesterday the ZB made it's move at around 8 AM EST. The ZB hit a Low at around that time and the S&P moved Lower. If you look at the charts below ZB gave a signal at around 8 AM EST and the S&P moved Lower at around the same time. Look at the charts below and you'll see a pattern for both assets. ZB hit a Low at around 8 AM EST and the S&P was moving Lower shortly thereafter. These charts represent the newest version of MultiCharts and I've changed the timeframe to a 15 minute chart to display better. This represented a long opportunity on the 30 year bond, as a trader you could have netted about a dozen ticks per contract on this trade. Each tick is worth $31.25. Please note: the front month for the ZB is now Sept '20. The S&P contract has been changed to Sept '20. I've changed the format to Renko bars such that it may be more apparent and visible.
Charts Courtesy of MultiCharts built on an AMP platform
Bias
Yesterday we gave the markets an Upside bias as both the USD and the bonds were trading Lower Monday morning and this is usually indicative of an Upside day. The markets didn't disappoint as the Dow gained 580 points and the other indices gained ground as well. Today we aren't dealing with a correlated market and our bias is to the Downside.
Could this change? Of Course. Remember anything can happen in a volatile market.
Commentary
No one feels any safer after 24 hours and in fact Arizona is now reversing its open and has gone into partial shutdown mode as Arizona has witnessed a spike in the number of coronavirus cases. In terms of market news there really wasn't any to speak of although Pending Home Sales showed significant improvement. From our point of view we judge each trading day separately and as of that day. We utilize our rules on Market Correlation as they rarely let us down. Am I saying that our rules are 100%? Not at all, in fact if anyone makes that claim run because they aren't being very forthright with you. We would feel comfortable saying 70 - 80% which is more realistic. Today we have a number of FOMC members speaking and that can move the markets in any direction but we will stick by our rules nonetheless as they have rarely let us down.
Author

Nick Mastrandrea
Market Tea Leaves


