Traders relieved as US inflation is not running away

Market Overview
As markets have settled down, the weakness on the US dollar has come back to the fore. This outlook has been helped in the wake of yesterday’s US CPI inflation data which has been a big focus for trades ever since the payrolls report a couple of weeks ago. Although there was a mild upside surprise in the data, there was not enough in the release to see widespread panic returning once more. There was an appreciable initial knee-jerk push of dollar strength, however this turned completely around as the outlook showed inflation was beginning to turn a corner, but not spiking higher in a sense that would have resulted in a massive and sustainable risk off move. Rising inflation in a controllable fashion is positive for markets and retains an outlook of dollar negativity. The fact that there was no rampant uptick in inflation means that the dollar should not remain under pressure again. The outlook of December/January can now resume. Equities have found support, whilst Treasury yields are ticking higher. The 10 year yield is above 2.90% and looks on course to test 3.0 % in the coming weeks. As long as inflation does not show further signs of spiking higher, then the market will remain fairly sanguine about the move.

Wall Street closed solidly higher and seems to show that the bulls are back in the driving seat once more. The S&P 500 was up +1.3% at 2699 whilst Asian markets were also positive (Nikkei +1.5%) and European markets are following suit with solid gains in early moves. In forex, we see the dollar under pressure across the majors, but once again the standout performer is the Japanese yen. Australian employment continues to improve but is having little real impact on the Aussie yet today. In commodities the dollar weakness is again helping to underpin gains on gold, whilst finally it seems that the bulls are starting to find some traction on the oil price.
After the US CPI came in higher than expectations yesterday the factory gate inflation will take some of the focus today. US PPI is released at 1330GMT and is expected to show the headline PPI dropping to +2.5% (from +2.6%) and the core PPI dropping to +2.1% (from +2.3%). The Empire State Fed Manufacturing is at 1330GMT and is expected to show another strong +17.5 (from +17.7 last month), whilst the Philly Fed Business is also at 1330GMT and is expected to also tick slightly lower to +21.1 (from +22.2). US Industrial Production is at 1415GMT and is expected to show growth of +0.2% for the month and see Capacity Utilization improve to 78.0 (from 77.9).
Chart of the Day – FTSE 100
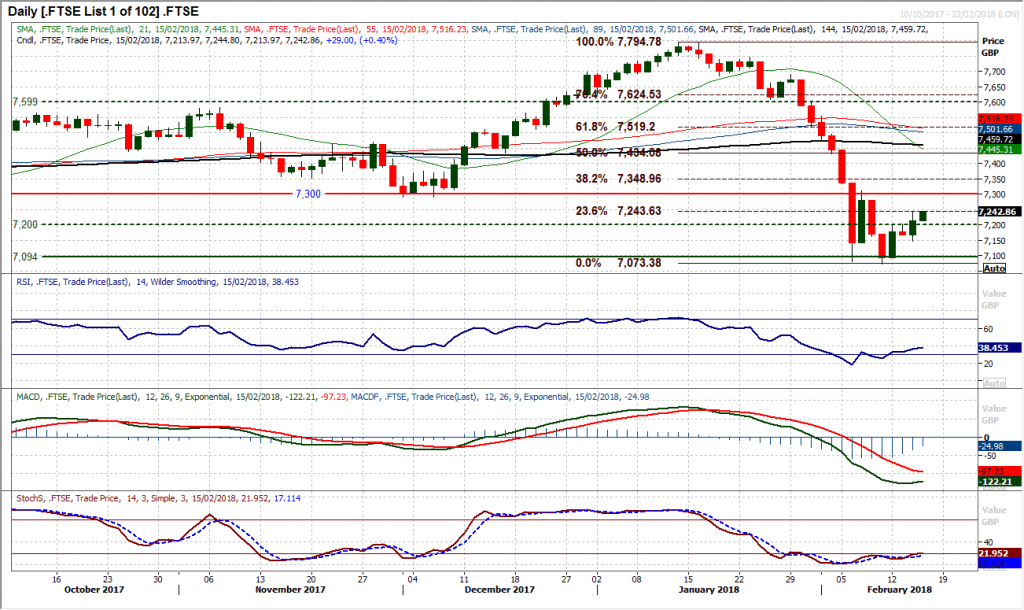
It seemed that European equity markets had something of a near term breakthrough yesterday that could now open the way for continued recovery. The volatility that resulted from the US inflation reading ultimately pulled the buyers back into the market and there was a change in sentiment. A close above 7200 was significant in that this was an old key level of support which had been preventing the bulls from taking off in the early stages of this week. A bullish engulfing candle is a second very strong positive candle this week and has now left a higher low at 7145. The near term signals on the momentum indicators are also improving with the pull higher in the RSI and Stochastics, with small positive divergences too. The resistance at 7300 will now be key for the recovery as this is another old key floor than has turned resistance and became a basis for the failure of the first spike rally last week. A close above 7311 would confirm the bulls are in recovery mode. The hourly chart shows that during the recent selling phase the hourly RSI did not get above 60 and the hourly MACD lines failed around neutral. Improving this situation would add to the rebound potential. The bulls will be eying a move above the 23.6% Fibonacci retracement of the sell-off from 7795/7073 at 7244 which would open 38.2% at 7349.
EUR/USD
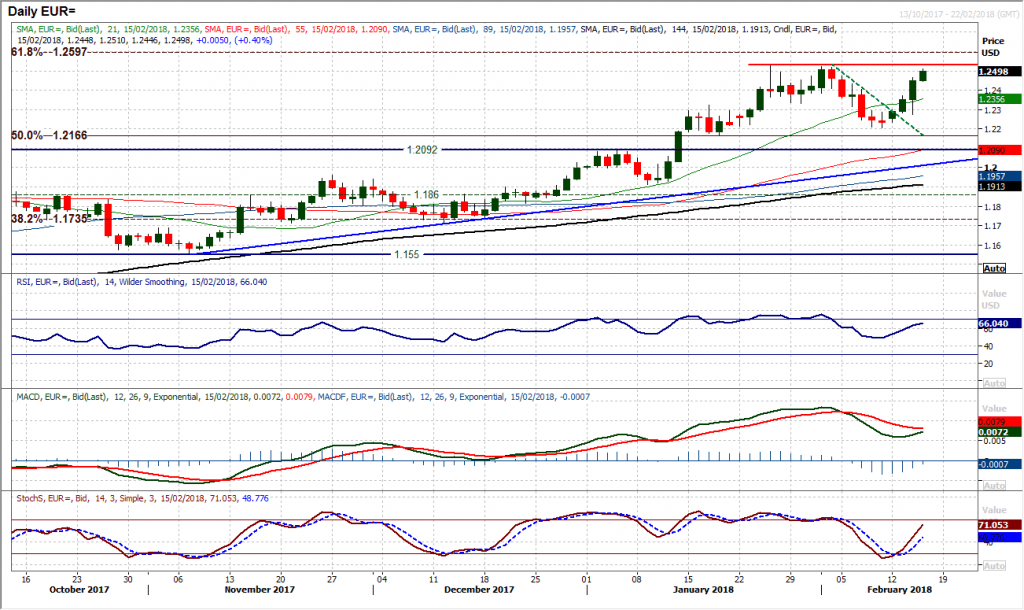
Despite the intraday volatility on the back of the US CPI data yesterday, the bulls seem to be back in control once more. A strong bull candle and 100 pip gain on the day has swung the outlook positive and the bulls will now be eying a retest of the key January high at $1.2535. Momentum indicators are positively configured with the Stochastics and RSI tracking higher in the low 60s and the MACD lines bottoming above neutral again. There is a slight degree of consolidation early today, but intraday corrections will be seen as a chance to buy. The hourly chart shows a band of near term breakout support now between $1.2390/$1.2430.
GBP/USD
With an impressively strong bullish candle having been posted yesterday, the recovery on Cable is beginning to find traction. The intraday volatility has left a higher low at $1.3795 but the bulls will be more interested with what is going on overhead now. Momentum indicators are confirming the improvement, with Stochastics having swung higher with a positive signal, the MACD lines bottoming and the RSI also ticking higher above 50. A small downtrend has also been broken and the bulls are now testing the key near term resistance band $1.3975/$1.4065. A closing break above $1.4065 would re-open the key highs, with $1.4275 and $1.4345 potentially then on the cards. The hourly chart is an improving outlook now and the bulls will need to put down a marker for any intraday unwind. There is now a basis of support $1.3920/$1.3975 and a higher low around here, with the hourly RSI holding up above 40/50 and hourly MACD lines above neutral will continue the recovery.

USD/JPY
There has been a decisive shift in sentiment on Dollar/Yen in recent weeks and the bears are in complete control now. Even the slightest of intraday rallies are being sold into as the market now looks to be confirming a breakdown of the key September 2017 low at 107.30. With the hugely negative configuration on the momentum indicators, there is downside potential in the move and any strength is a chance to sell. The next support is only minor around 105.50 but there is little real support of any significance until 102.55. The hourly chart reflects this selling momentum, with old support becoming new resistance, meaning 106.80 and then 107.40 should be a gauge should the market rebound today. The old key support of the September low at 107.30 is now a basis of resistance too.

Gold
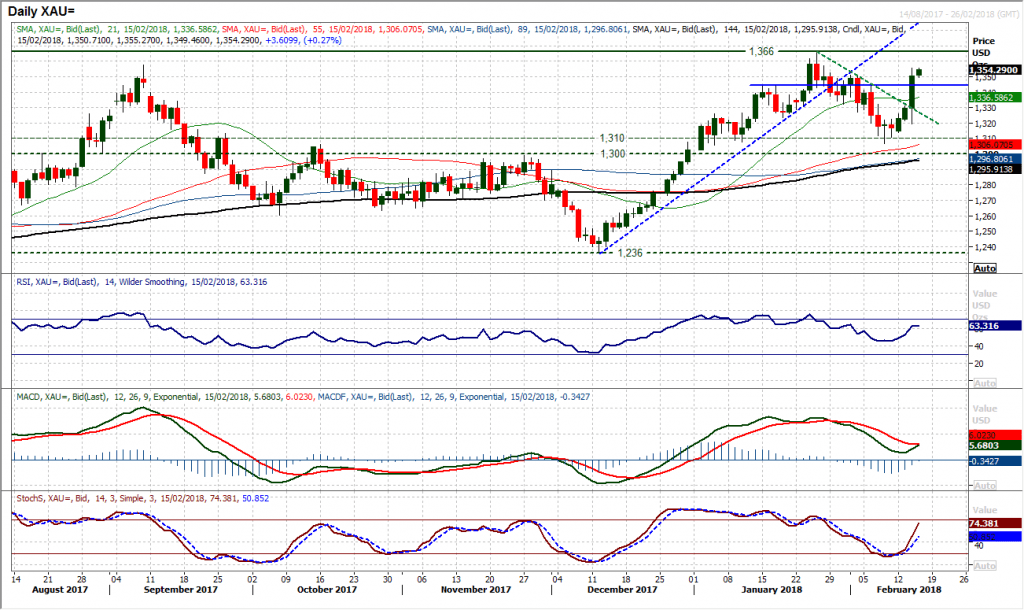
Once the market had begun to digest the US CPI data yesterday, it was clear that the bulls too it as a chance to buy again. A hugely impressive bullish engulfing candle formed to take gold through a clutch of key resistance levels and re-open the $1366 key January high once more. The move means that momentum indicators are once more rising strongly and the MACD lines are on the brink of a bull cross. Another positive start in Asian trading today certainly keeps up the potential for further gains. The hourly chart shows strong momentum but this could now mean a near term intraday unwind, but tis would also provide the next chance to buy. There is a basis of support $1337/$1345 to continue the higher lows. Initial resistance is at $1355.50 from yesterday’s high.
WTI Oil
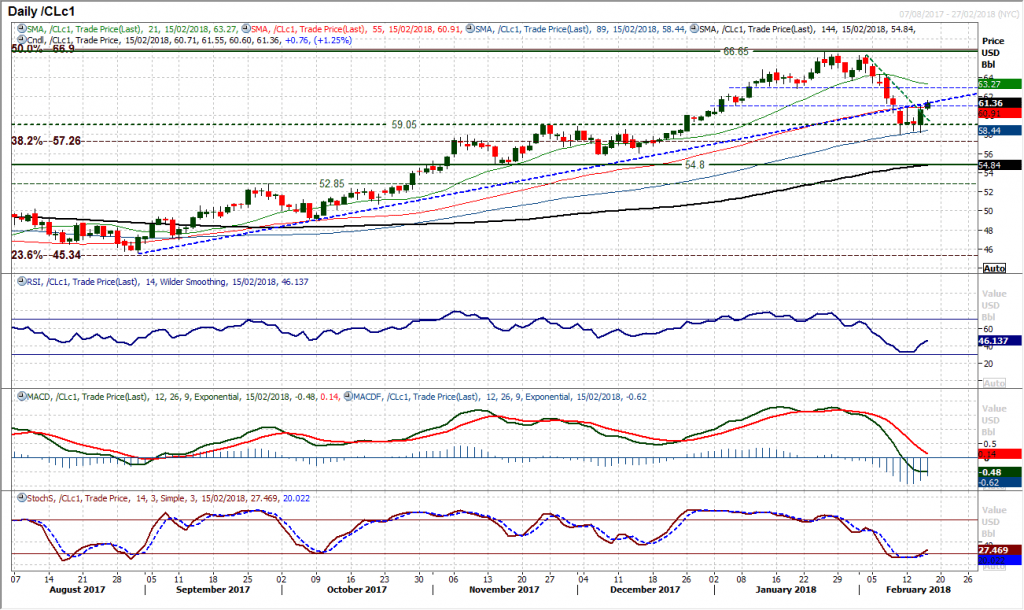
The slightly lower than expected crude oil inventories and a bout of renewed dollar weakness has helped to underpin support on oil. This has helped to form a strong bull candle and is now taking the market through a confluence of resistance levels. A bullish engulfing candlestick formation also shows that there is a basis of support now at Friday’s low of $58.05 which the market is watching. The near term breakouts are being seen now as the market has continued higher today. A mini-down trend at $59.70, with the 55 day moving average at $60.90, whilst Monday’s rebound high at $60.85 and the underside of the old uptrend. These levels are all breaking to the upside now. A close above $60.85 would confirm the shift in sentiment, with intraday weakness now a chance to buy. The hourly chart shows $60.85 is now a basis of support.
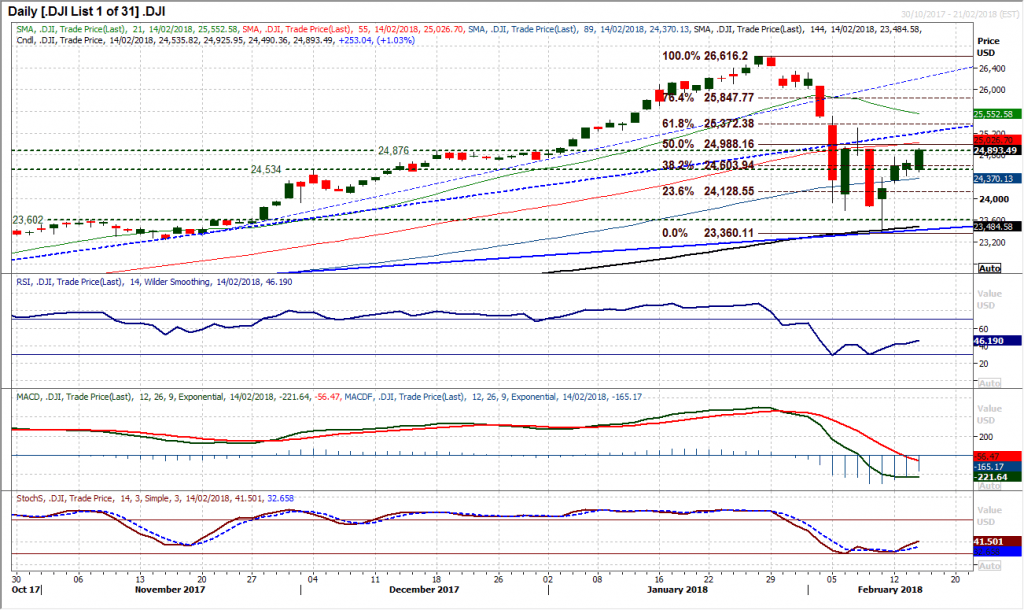
Dow Jones Industrial Average
Considering the increase in volatility yesterday afternoon, the bulls reacted positively and looked the support the initial selling pressure. It is interesting to see the bulls reacting well over the course of this week, with a series of bull candles. The bulls will now be looking to hold on to a decisive move above 24,604 which is the 38.2% Fib retracement of the sell-off from 26,616/23,360 which is now testing the 50% Fib level around 24,988. This also means that 24,604 becomes a basis of support now. The daily momentum indicators are picking up and are looking to build a recovery now. The hourly chart though continues to show 60 is a barrier on the RSI for the bulls, whilst the initial resistance at 24,765 will be watched in the potential formation of a higher low at 24,421.
Author

Richard Perry
Independent Analyst


