EUR/TRY 1H Chart: Descending Triangle
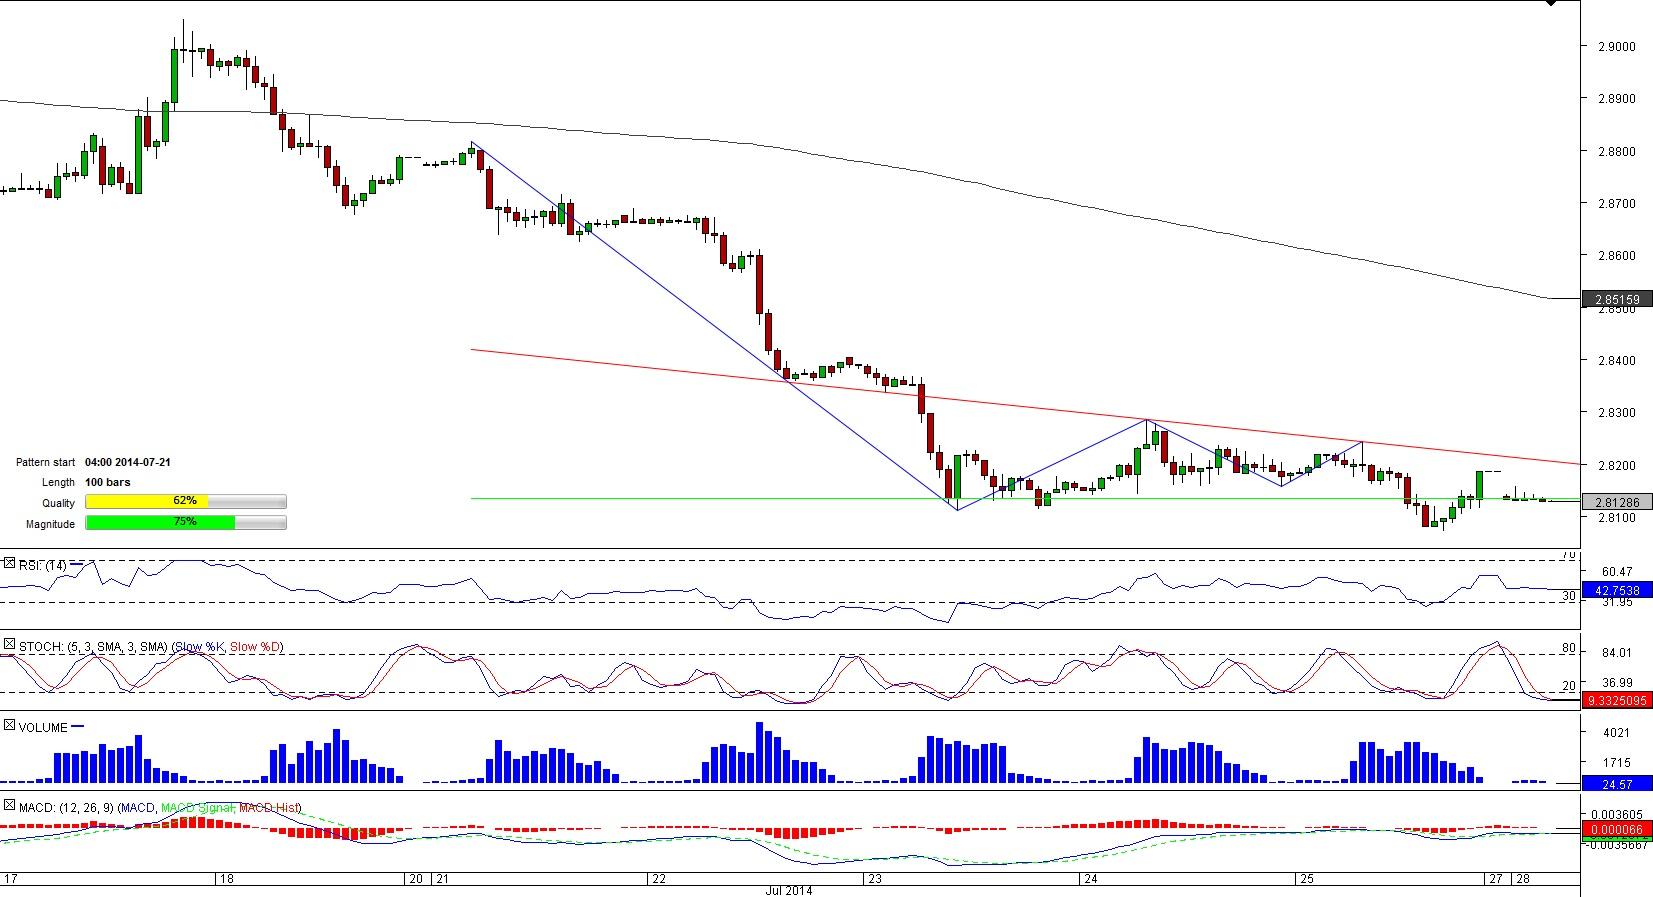
Comment: A dive to a nine-month low of 2.8071 took place when EUR/TRY exited a 100-bar long descending triangle pattern started in the second part of July. Despite plunging to the recent low, the pair managed to confirm that the breakout was false by settling above the lower boundary of the formation at 2.8134 a few hours earlier.
However, market players still are not convinced in the pair’s ability to remain inside the pattern – more than 90% of all orders on the SWFX are placed to sell the currency pair. Technical indicators also support the traders’ view, sending ‘sell’ signals for medium and long terms.
CHF/SGD 1H Chart: Channel Down
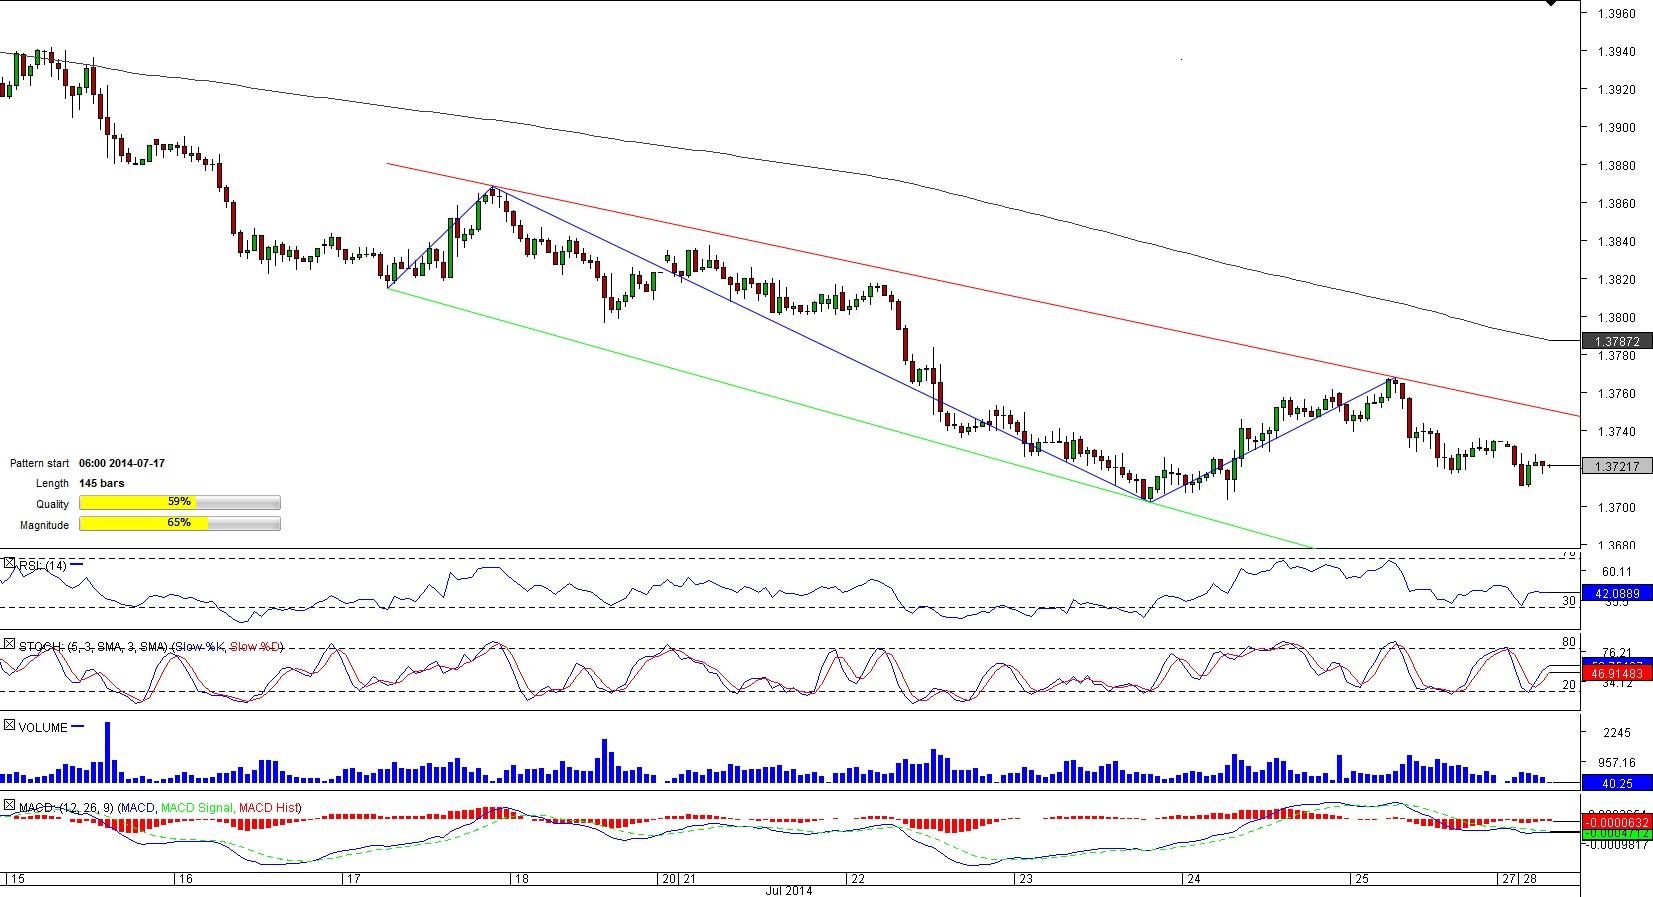
Comment: The beginning of July was a starting point of a long-lasting depreciation performed by CHF/SGD. Currently, the retreat is developing inside a 145-bar long channel down pattern and there are no indications of the pair’s willingness to reverse its trend in the foreseeable future.
The instrument is sitting in the upper range of the corridor but its ability to re-test the tunnel’s limit is questionable given several obstacles that lie on the pair’s way towards this formidable resistance. The level of 1.3725/30 (daily PP, R1; four-hour R1) represents the first hindrance, while 1.3737/8 (four-hour R2; 50-hour SMA; daily R2) and 1.3743/6 (daily R3; four-hour R3) also are significant constraints for a climb.
USD/NOK 1H Chart: Rising Wedge
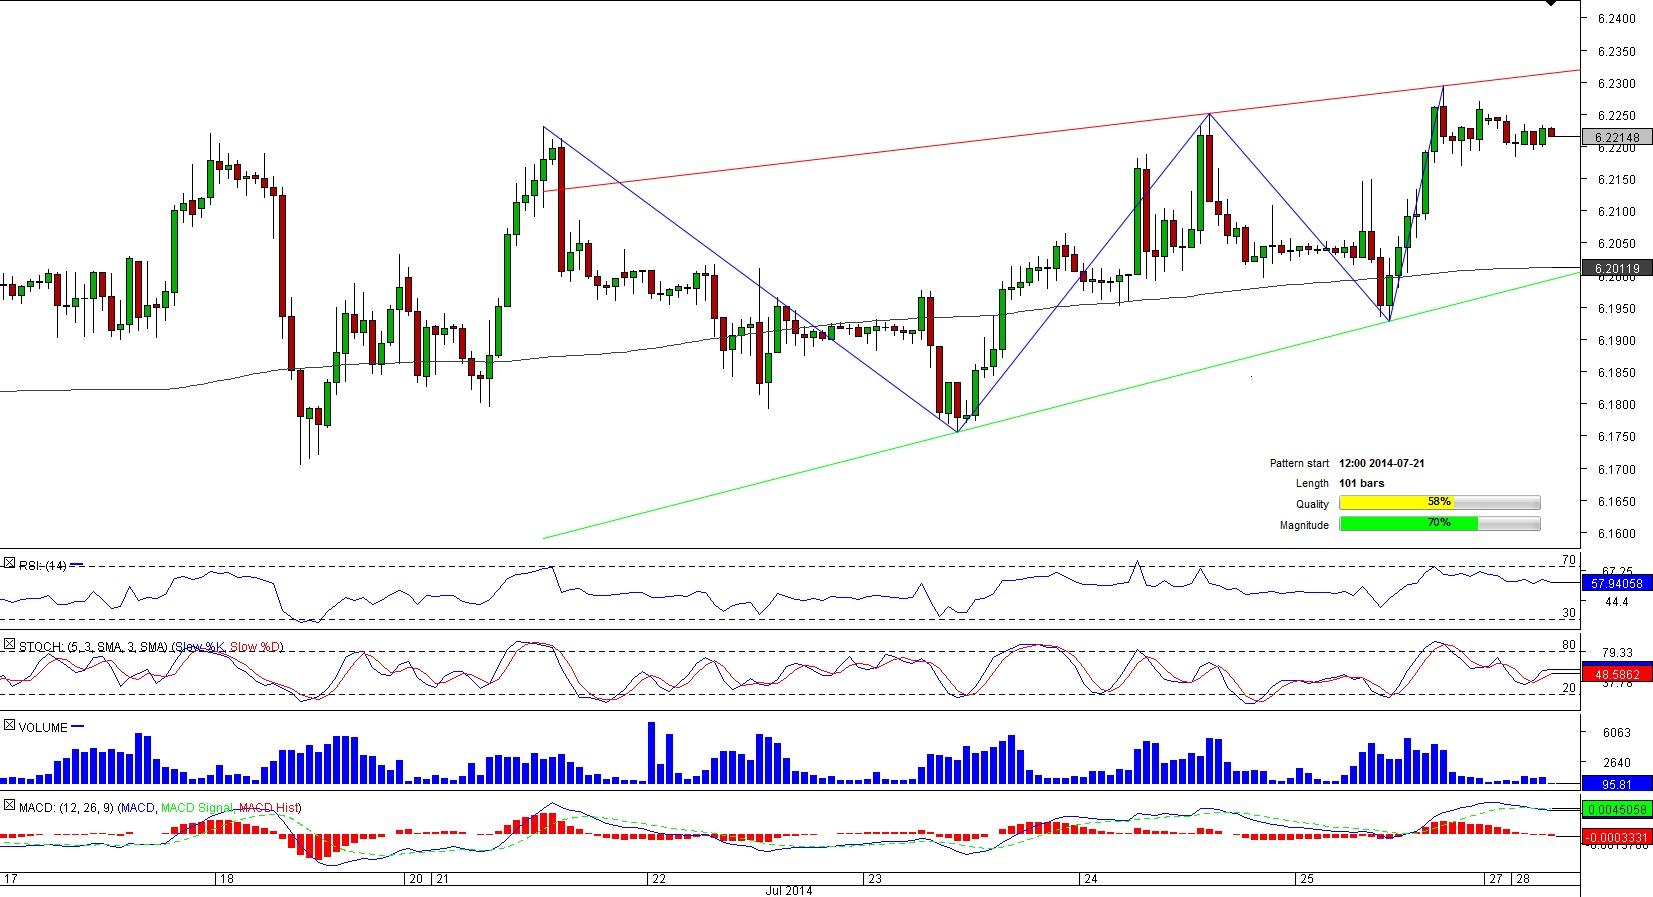
Comment: Following a rise to a six-month high of 6.2648, USD/NOK was trading sideways, slightly below the recent peak. However, more than two weeks of tranquillity ended on Jul 21 when the instrument entered a rising wedge pattern.
At the moment the pair is vacillating not far away from the upper boundary of the formation but the bullish trend is expected to end soon considering bearish SWFX sentiment – four traders out of five bet on depreciation of the pair is the hours to come. Meanwhile, technical indicators contradict to the opinion expressed by SWFX players—technical signals are bullish for medium and long terms.
AUD/CAD 1H Chart: Channel Up
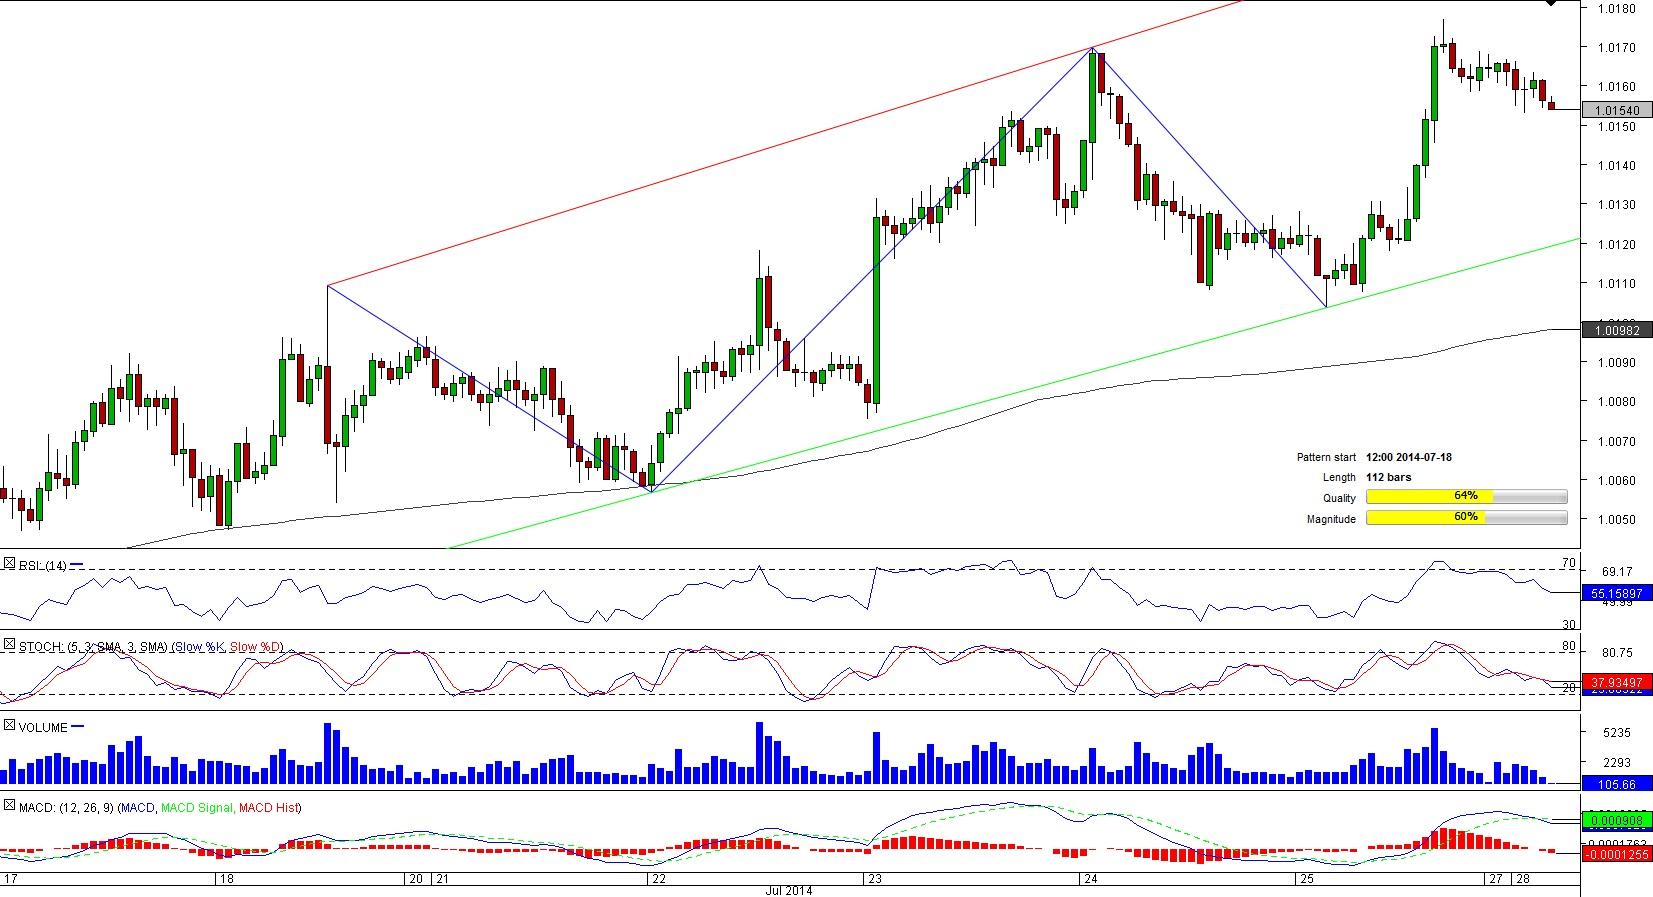
Comment: The pair of currencies used in two different parts of the world, AUD/CAD, has been tilted upwards since the very beginning of the month and on Jul 21 the instrument embarked upon formation of the bullish tunnel that now is over 110-bar long.
AUD/CAD is likely to move in the northern direction before long as suggested by the SWFX numbers – about two thirds of market players are bullish on the pair. To confirm this, the currency couple will have to target the levels of 1.0158/67 (four-hour PP, R1; daily R1) and 1.0171/6 (four-hour R2, R3; daily R2, R3), a jump above which will push a one-month high of 1.0178 to the fore.
This overview can be used only for informational purposes. Dukascopy SA is not responsible for any losses arising from any investment based on any recommendation, forecast or other information herein contained.
Recommended Content
Editors’ Picks
EUR/USD edges lower toward 1.0700 post-US PCE

EUR/USD stays under modest bearish pressure but manages to hold above 1.0700 in the American session on Friday. The US Dollar (USD) gathers strength against its rivals after the stronger-than-forecast PCE inflation data, not allowing the pair to gain traction.
GBP/USD retreats to 1.2500 on renewed USD strength

GBP/USD lost its traction and turned negative on the day near 1.2500. Following the stronger-than-expected PCE inflation readings from the US, the USD stays resilient and makes it difficult for the pair to gather recovery momentum.
Gold struggles to hold above $2,350 following US inflation

Gold turned south and declined toward $2,340, erasing a large portion of its daily gains, as the USD benefited from PCE inflation data. The benchmark 10-year US yield, however, stays in negative territory and helps XAU/USD limit its losses.
Bitcoin Weekly Forecast: BTC’s next breakout could propel it to $80,000 Premium

Bitcoin’s recent price consolidation could be nearing its end as technical indicators and on-chain metrics suggest a potential upward breakout. However, this move would not be straightforward and could punish impatient investors.
Week ahead – Hawkish risk as Fed and NFP on tap, Eurozone data eyed too

Fed meets on Wednesday as US inflation stays elevated. Will Friday’s jobs report bring relief or more angst for the markets? Eurozone flash GDP and CPI numbers in focus for the Euro.


