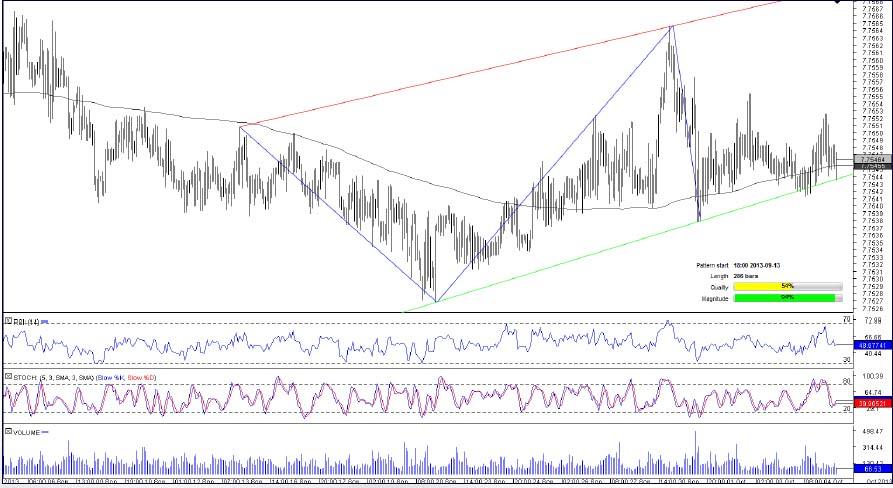
USD/HKD 1H Chart: Channel Up
Comment: On Sep 13, the pair neared but did not quite reach its 50-hour SMA, the move that became a starting point of the channel up pattern, within which the pair, firstly, tumbled to almost a three-month low but then recovered, peaking at almost one-month high on Sep 30. The outlook on the pair seems uncertain. On the one hand, 50-hour SMA is nearing 200-hour SMA, raising the death cross risk. Adding buying pressure, the USD/HKD is trading close to the up-trend support, a dive below which is likely to result in a sharp decline. On the other hand, traders are strongly bullish on the pair (87.50% of all positions are long), according to SWFX data.
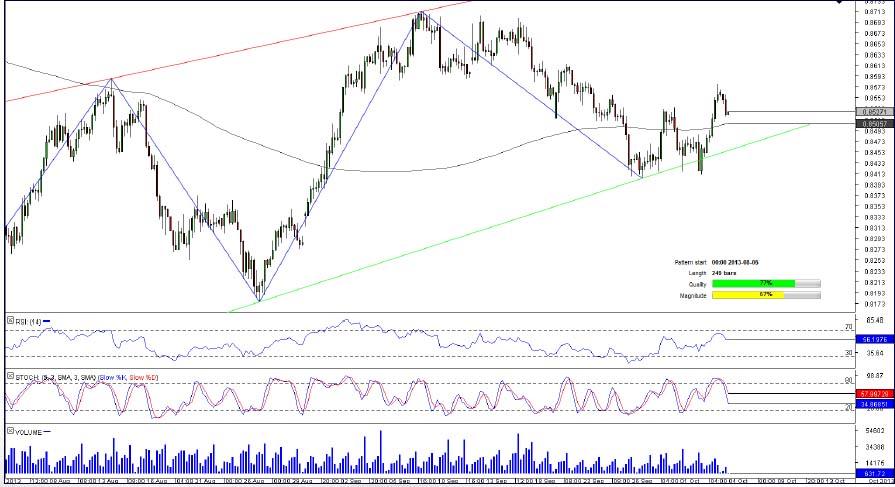
AUD/CHF 4H Chart: Rising Wedge
Comment: Having hit a seven-month high on March 27, the Australian Dollar changed its direction against the Swiss Franc and was depreciating until it reached almost a two-year low on August 5. Since then, AUD/CHF has been faltering between two upward-sloping, gradually converging lines, forming a rising wedge pattern. Now, the pair is attempting to remain above 0.8523 (daily S3) and is likely to succeed in this endeavour as suggested by the SWFX data showing that market participants hold long positions in 85% of cases. However, technical indicators are sending less optimistic signals, predicting a decline in medium-and long-term.
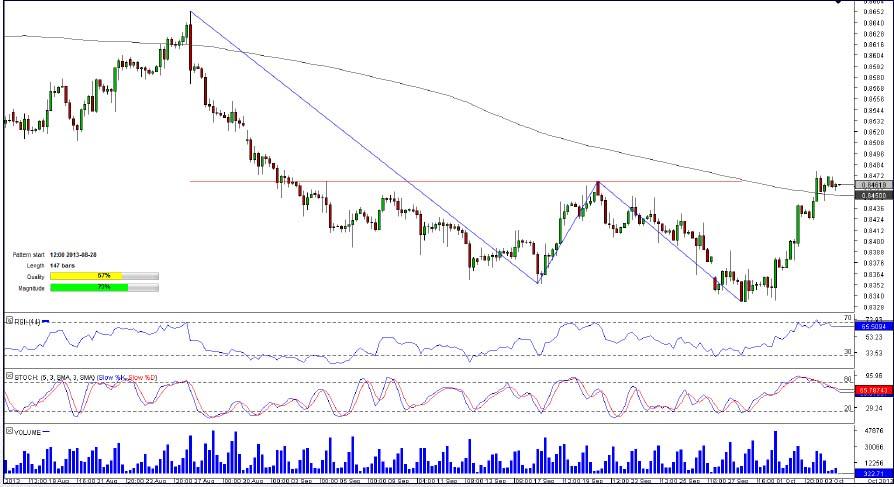
EUR/GBP 4H Chart: Double Bottom
Comment: EUR/GBP surpassed its 200-bar SMA on August 13, reaching a two-week high; however, this move substantially enfeebled the pair that started a long-term downside trend on August 28. EUR/GBP formed a double bottom pattern by dropping to almost seven-month low on Sep 18 but bouncing off this level to hit a formidable resistance at 0.8465 that sent the pair again to the seven-month low of 0.8332, the level that created a buying pressure thus pushing the pair to the up-trend resistance sitting at 0.8465. If the pair overcomes the up-trend resistance, it is likely to start a rally as a break-out from resistance of the double bottom pattern often provides an impulse for appreciation of the pair.
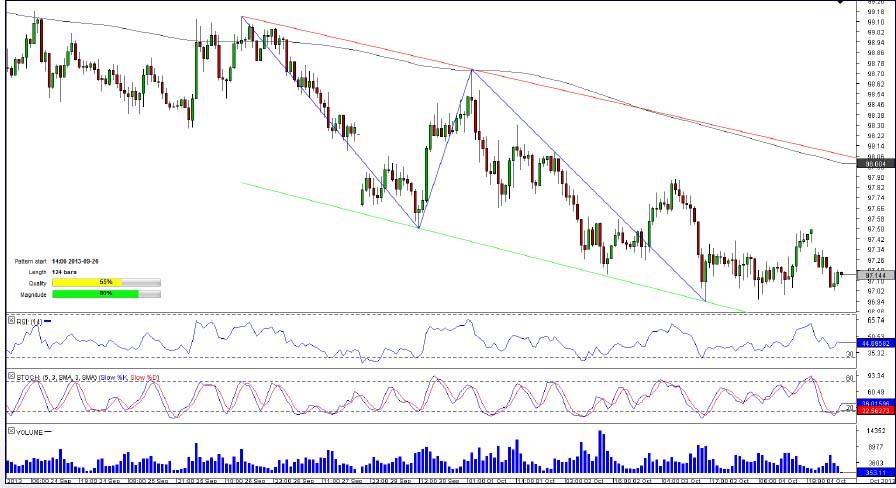
USD/JPY 1H Chart: Channel Down
Comment: A jump to a two-month high on Sep 11 provoked a sharp decline of USD/JPY; however, the channel down pattern started only on Sep 26. Recently, the currency couple has bounced off a one-month low and is currently trading at the four-hour pivot point at 97.15. Despite bearishness of the pattern, 64.96% of the market players bet on the appreciation of the pair. The confirmation of this outlook will be a break through the region of 97.15 (four-hour PP) and a test of 97.25/32 (daily PP and 50-hour SMA). At the same time, if the pair prolongs its downside trend, it may drop below 97.06/6.97 (daily S1, S2; four-hour S1) that would bring a one-month low back into the picture.
This overview can be used only for informational purposes. Dukascopy SA is not responsible for any losses arising from any investment based on any recommendation, forecast or other information herein contained.
Recommended Content
Editors’ Picks
EUR/USD edges lower toward 1.0700 post-US PCE

EUR/USD stays under modest bearish pressure but manages to hold above 1.0700 in the American session on Friday. The US Dollar (USD) gathers strength against its rivals after the stronger-than-forecast PCE inflation data, not allowing the pair to gain traction.
GBP/USD retreats to 1.2500 on renewed USD strength

GBP/USD lost its traction and turned negative on the day near 1.2500. Following the stronger-than-expected PCE inflation readings from the US, the USD stays resilient and makes it difficult for the pair to gather recovery momentum.
Gold struggles to hold above $2,350 following US inflation

Gold turned south and declined toward $2,340, erasing a large portion of its daily gains, as the USD benefited from PCE inflation data. The benchmark 10-year US yield, however, stays in negative territory and helps XAU/USD limit its losses.
Bitcoin Weekly Forecast: BTC’s next breakout could propel it to $80,000 Premium

Bitcoin’s recent price consolidation could be nearing its end as technical indicators and on-chain metrics suggest a potential upward breakout. However, this move would not be straightforward and could punish impatient investors.
Week ahead – Hawkish risk as Fed and NFP on tap, Eurozone data eyed too

Fed meets on Wednesday as US inflation stays elevated. Will Friday’s jobs report bring relief or more angst for the markets? Eurozone flash GDP and CPI numbers in focus for the Euro.


