How bullish and bearish forces align for stock indexes, forex and other global markets, both technical and fundamental outlooks, likely top market movers. Despite all the headlines, neither economic data nor the Russian invasion of Ukraine moved markets. Here’s what did.
Summary
- Technical Outlook: European stocks rise, close gap with US, Asia, despite miserable data, Russian invasion of Ukraine. Guess Why?
- Fundamental Outlook: The only market driver that really matters, how long the bull market can last, why, and what to monitor.
- The Key Questions: What to ask for the coming week and beyond.
The following is a partial summary of the conclusions from the fxempire.com weekly analysts’ meeting in which we cover outlooks for the major pairs for the coming week and beyond.
Technical Picture
We look at the technical picture first for a number of reasons, including:
Chart Don’t Lie: Dramatic headlines and dominant news themes don’t necessarily move markets. Price action is critical for understanding what events and developments are and are not actually driving markets. There’s nothing like flat or trendless price action to tell you to discount seemingly dramatic headlines – or to get you thinking about why a given risk is not being priced in
Charts Also Move Markets: Support, resistance, and momentum indicators also move markets, especially in the absence of surprises from top tier news and economic reports. For example, the stronger a given support or resistance level, the more likely a trend is to pause at that point. Similarly, a confirmed break above key resistance makes traders much more receptive to positive news that provides an excuse to trade in that direction.
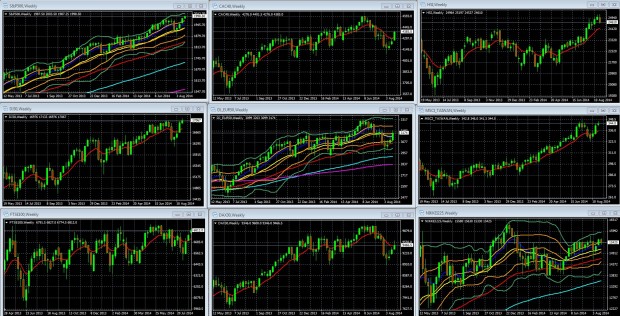
Overall Risk Appetite Medium Term Per Weekly Charts Of Leading Global Stock Indexes
Weekly Charts Of Large Cap Global Indexes May 12 2013 To August 29 2014: With 10 Week/200 Day EMA In Red: LEFT COLUMN TOP TO BOTTOM: S&P 500, DJ 30, FTSE 100, MIDDLE: CAC 40, DJ EUR 50, DAX 30, RIGHT: HANG SENG, MSCI TAIWAN, NIKKEI 225
Key For S&P 500, DJ EUR 50, Nikkei 225 Weekly Chart: 10 Week EMA Dark Blue, 20 WEEK EMA Yellow, 50 WEEK EMA Red, 100 WEEK EMA Light Blue, 200 WEEK EMA Violet, DOUBLE BOLLINGER BANDS: Normal 2 Standard Deviations Green, 1 Standard Deviation Orange.
Source: MetaQuotes Software Corp, www.fxempire.com, www.thesensibleguidetoforex.com
02 Aug. 31 11.06
Key Points & Lessons
European Indexes Closing Performance Gap On Rising Stimulus HopesFor Europe, the week brought more evidence of deterioration in both economic data and the Ukraine crisis. Nonetheless, European stocks made their third straight weekly advance. As a result they
- Broke or are close to breaking their 2 month old downtrend lines.
- Moved firmly into their double Bollinger® band neutral zones, signaling a bottoming is in as momentum is now firmly neutral rather than negative.
- Closed the performance gap with Asia and the US
So if everything is getting worse why did European stocks rise? For the same reason they’ve advanced in other regions in the face of sustained periods of bad fundamentals. It’s another week of the “bad news equals good news trade.” For those somehow still unfamiliar with this phenomenon, it means that because bad news implies more central bank stimulus is coming, stocks rise because that new cash injection into markets is expected to prop up stock prices.
The bad news equals good news trade needs to things to work:
- Consistently bad economic data showing stagnant or declining growth. Check.
- Investors interpret central bank comments to mean that they will add new stimulus programs if things don’t turn around soon, or that such programs are already in the pipeline and that it’s just a matter of weeks before they’re announced. Check, ever since Draghi’s impromptu Jackson Hole comments in which he admitted that deflation was not merely temporary but rather a longer term problem.
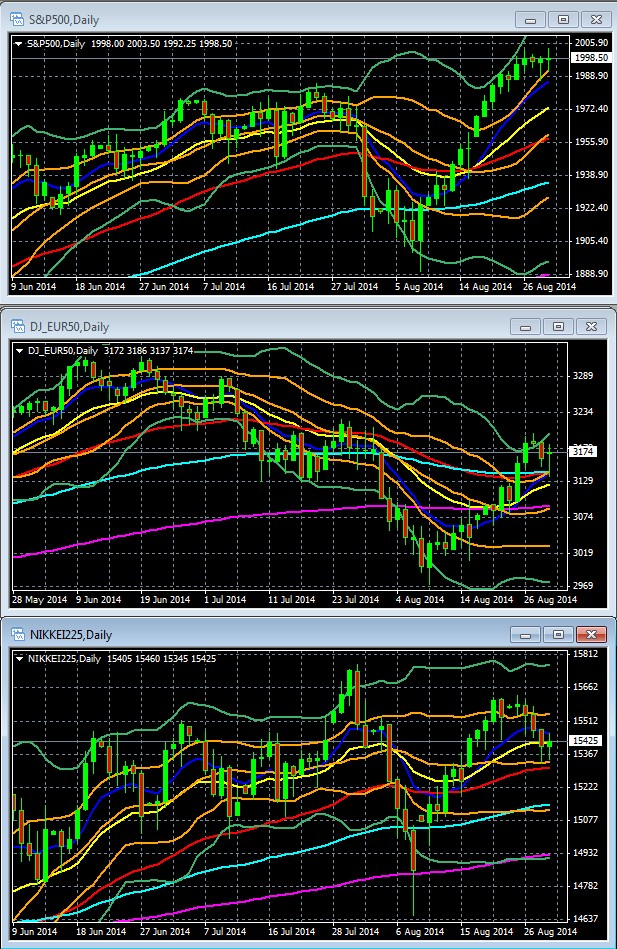
Daily Charts / Short Term Coming Weeks
Recommended Content
Editors’ Picks
EUR/USD edges lower toward 1.0700 post-US PCE

EUR/USD stays under modest bearish pressure but manages to hold above 1.0700 in the American session on Friday. The US Dollar (USD) gathers strength against its rivals after the stronger-than-forecast PCE inflation data, not allowing the pair to gain traction.
GBP/USD retreats to 1.2500 on renewed USD strength

GBP/USD lost its traction and turned negative on the day near 1.2500. Following the stronger-than-expected PCE inflation readings from the US, the USD stays resilient and makes it difficult for the pair to gather recovery momentum.
Gold struggles to hold above $2,350 following US inflation

Gold turned south and declined toward $2,340, erasing a large portion of its daily gains, as the USD benefited from PCE inflation data. The benchmark 10-year US yield, however, stays in negative territory and helps XAU/USD limit its losses.
Bitcoin Weekly Forecast: BTC’s next breakout could propel it to $80,000 Premium

Bitcoin’s recent price consolidation could be nearing its end as technical indicators and on-chain metrics suggest a potential upward breakout. However, this move would not be straightforward and could punish impatient investors.
Week ahead – Hawkish risk as Fed and NFP on tap, Eurozone data eyed too

Fed meets on Wednesday as US inflation stays elevated. Will Friday’s jobs report bring relief or more angst for the markets? Eurozone flash GDP and CPI numbers in focus for the Euro.

