![]() Harry S. Dent, MBA
Harry S. Dent, MBA
Dent Research
Last Friday I talked about how we have been in a muted Economic Winter Season. We may have had the greatest stock market bubble ever, but our economic “recovery” has been the weakest on record, despite the strongest, globally-concerted stimulus ever.
Here’s a chart comparing the real GDP for the 11 years from the 1929 top through the 1940 bottom to the 11 years from 2007 to 2018.
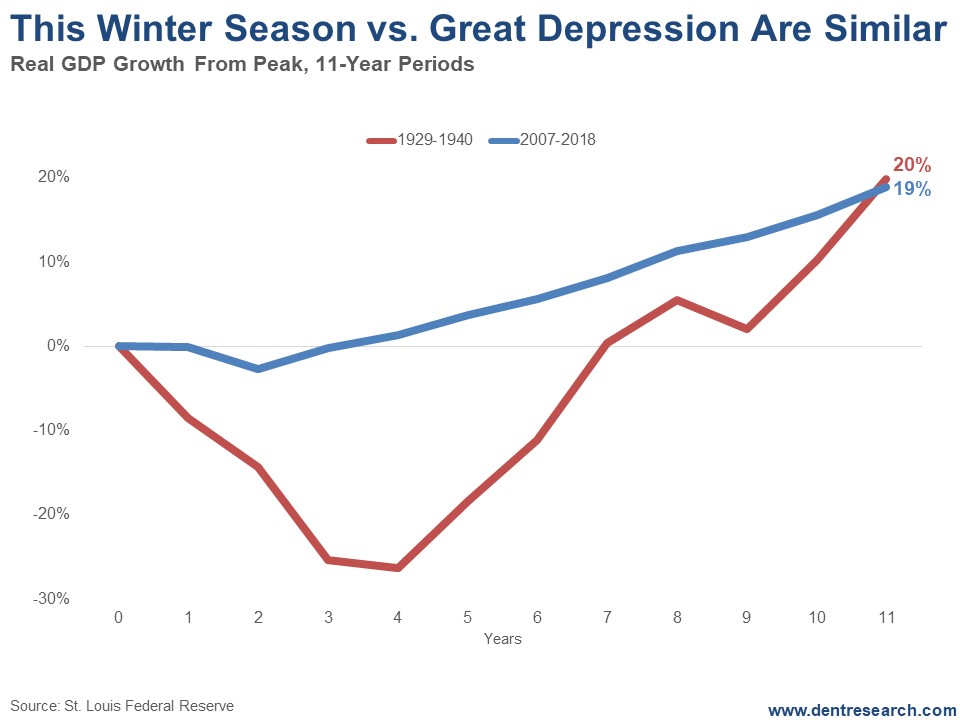
Notice how the cumulative GDP growth since 2007 is 19%? It was 20% from 1929 through 1940. That means this period has actually been slightly worse.
How could this be?
The clear difference is that the Great Depression started with the greatest crash in U.S. history, with stocks down 89%, 25% unemployment, and a GDP fall of 30% between 1929 and 1933.
Think of it like the Big Bang. The explosion came at the beginning and everything took shape from there.
The current Economic Winter Season also started with a stock crash and high unemployment: 54% loss in the markets, near 11% unemployment, and a GDP fall of 4.3%.
Mild in comparison…
But the recovery from 1933 to 1937 saw average real GDP growth of a whopping 9% per year. We’ve managed to eke out just 2% per year. Then there was a less severe crash and mini-depression or great recession in 1938 that lingered into 1942. Stocks bottomed in 1942 and the next great long-term bull market began.
What does this mean?
The next chart shows real GDP on a 10-year moving average to smooth out the trends.

Look at that remarkable difference: The period after 2007, with an average of 2% GDP, has already been lower than the extended recession and inflation trends of the Economic Summer Season from 1968 to 1982.
This tells me that this Economic Winter Season will go out with a bang (as opposed to beginning with one, like with the Great Depression).
A final deep depression, debt deleveraging and economic crisis will see a 20%-plus fall in GDP, 15%-plus unemployment, and a stock crash that could rival that -89% for the Nasdaq and maybe even the Dow.
Talk about ass-backward.
The good news…
The good news is that my four key fundamental indicators are generally at their worst between 2020 and 2023 and turn up one by one after 2020. The Geopolitical Cycle turns up after 2020 as does the sunspot-driven Boom/Bust Cycle. The U.S. Generational Spending Wave turns up in 2023, making the 45-year Technology Cycle the last to flip, around 2032.
Hence, the worst of the next great crash is likely to occur by late 2020, and we won’t come out of it until 2023 or so.
After that, we should enjoy a stronger recovery and quick reforms that actually deal with the debt crisis this time.
Still, we won’t see as strong a recovery as that from 1933 forward because we face weaker demographic trends in the U.S. and developed world. The outstanding growth will occur in the emerging world, especially places like India and Southeast Asia.
I don’t expect that the central banks can create another heroic turnaround this time when their last “something for nothing” stimulus program fails so miserably. They didn’t deal with the debt and financial bubbles last time, so expect the worst ahead after this final bubble peaks later this year, or early 2020 at the latest.
The content of our articles is based on what we’ve learned as financial journalists. We do not offer personalized investment advice: you should not base investment decisions solely on what you read here. It’s your money and your responsibility. Our track record is based on hypothetical results and may not reflect the same results as actual trades. Likewise, past performance is no guarantee of future returns. Certain investments such as futures, options, and currency trading carry large potential rewards but also large potential risk. Don’t trade in these markets with money you can’t afford to lose. Delray Publishing LLC expressly forbids its writers from having a financial interest in their own securities or commodities recommendations to readers.
Recommended Content
Editors’ Picks
EUR/USD edges lower toward 1.0700 post-US PCE

EUR/USD stays under modest bearish pressure but manages to hold above 1.0700 in the American session on Friday. The US Dollar (USD) gathers strength against its rivals after the stronger-than-forecast PCE inflation data, not allowing the pair to gain traction.
GBP/USD retreats to 1.2500 on renewed USD strength

GBP/USD lost its traction and turned negative on the day near 1.2500. Following the stronger-than-expected PCE inflation readings from the US, the USD stays resilient and makes it difficult for the pair to gather recovery momentum.
Gold struggles to hold above $2,350 following US inflation

Gold turned south and declined toward $2,340, erasing a large portion of its daily gains, as the USD benefited from PCE inflation data. The benchmark 10-year US yield, however, stays in negative territory and helps XAU/USD limit its losses.
Bitcoin Weekly Forecast: BTC’s next breakout could propel it to $80,000 Premium

Bitcoin’s recent price consolidation could be nearing its end as technical indicators and on-chain metrics suggest a potential upward breakout. However, this move would not be straightforward and could punish impatient investors.
Week ahead – Hawkish risk as Fed and NFP on tap, Eurozone data eyed too

Fed meets on Wednesday as US inflation stays elevated. Will Friday’s jobs report bring relief or more angst for the markets? Eurozone flash GDP and CPI numbers in focus for the Euro.