![]() Northern Trust Economic Research Department
Northern Trust Economic Research Department
Northern Trust
Daydreaming recently at 30,000 feet, I remembered one of my father's favorite jokes. After a commercial jet takes off, an announcement comes over the intercom. "Ladies and gentlemen," it says, "this is the first passenger airplane directed by an autopilot program. It was developed by experts at IBM, and represents an exciting new application of computers. So with that, please sit back and enjoy your flight… enjoy your flight… enjoy your flight… enjoy your flight…"
I'm not sure why my father found that so funny, as the apparent computer malfunction would likely have stricken the passengers with fear. Implicit in the telling, perhaps, was that an actual pilot was in the cockpit with the ability to override the program if it strayed from the intended course.
A little over a year ago, the Federal Reserve published an outline of how it would go about reducing its balance sheet. The plan was activated last October. It called for a slow start and a gradual moderation to avoid an adverse economic reaction. Fed Chairman Jerome Powell recently reiterated the characterization his predecessor had offered: the effort is on "autopilot."
But recent events have cast doubt on the Fed's ultimate destination. Operating challenges have arisen, prompting speculation that the Fed may conclude its unwinding program sooner than expected. This may be one reason long-term interest rates in the United States have fallen over the past two months.
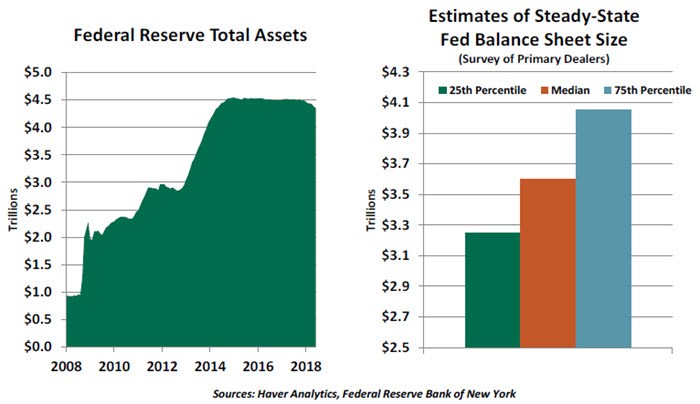
Almost ten years ago, the Federal Reserve began a quantitative easing (QE) program that more than quintupled the size of its balance sheet. At present, the Fed owns about $2.4 trillion worth of Treasury notes (11% of the total outstanding) and $1.7 trillion of mortgage-backed securities (19% of the total outstanding). The decision surrounding how much to return to private hands is therefore a potential market-mover, and there is considerable dispersion among analyst estimates of where the Fed will end up.
The uncertainty is rooted in the fact that there is no precedent to rely on. In a sense, reducing the balance sheet is just another way of withdrawing reserves from the financial system to modulate credit, growth and inflation. But QE of this scale has no precedent, leaving no past data to help calibrate the optimal size and speed of the reduction.
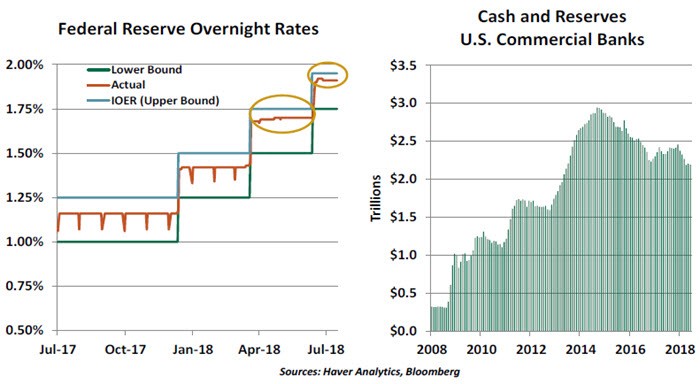
Further, the Fed has been struggling in its effort to manage the more traditional monetary lever of interest rates. To review, the Fed establishes a range for overnight interest rates, and then steers them from above and below. At the upper end is the interest rate on excess reserves (IOER) held by banks. Raising this rate offers banks a risk-free alternative to lending and (at the margin) should reduce the growth of credit.
At the lower end of the target range is the Fed's reverse repurchase agreement (repo) program. In these transactions, the Fed uses its securities holdings as the basis for borrowing money from market participants for short periods (paying them interest for doing so). These arrangements remove reserves from the system, thereby raising overnight rates.
 After resting comfortably in the middle of the target range for most of the past ten years, overnight interest rates began trending towards the top last spring. And demand from investors for reverse repos has fallen from about $150 billion daily last October to nearly zero in recent weeks. These events suggest a paradox: reserves appear to be getting scarce, even though there remain trillions of dollars of them in the U.S. banking system.
One reason for this might be that post-crisis reinforcement of bank capital and liquidity standards provided additional motivation for financial institutions to park money at the Fed. Central banks are low-risk counterparties, and balances held there count toward the liquidity coverage ratio (LCR) that financial institutions must maintain. Over the last year, increases in market rates have caused some bank depositors to drift back into investment products, heightening the need for banks to maintain liquid assets.
Without a clear picture of banks' demand function for reserves, managing monetary policy becomes more complicated. In June, the Federal Open Market Committee set the IOER five basis points lower than the upper end of its target range for interest rates. This was an attempt to steer overnight interest rates down, and to a degree, it has succeeded. But banks are still paying a higher rate for short-term funding than the Fed would like to see.
The shrinkage of the balance sheet has been slow so far; holdings are down just over $150 billion from their peak. The Fed has a set schedule for how the process will continue; declines of $40 billion to $50 billion per month are anticipated for the rest of 2018. Most think that there is a high bar for making alterations to the program in order to minimize uncertainty in markets.
 Few thought we might be approaching that bar so soon. But if signs of reserve scarcity persist, the Fed may have to reassess the neutral level of its balance sheet. If this level is raised, the central bank's securities holdings will not fall by as much as expected, which is one potential reason for the recent firming in Treasury note prices.
The ideal level of the Fed's balance sheet was debated two years ago at the Fed's Jackson Hole economic symposium, and the debate is likely to be resumed next month at the 2018 edition. As much as the Federal Reserve would like to leave its balance sheet reduction program on autopilot, it may have to consider a manual override.
Cash is Still King
Many of us have noticed the same bills remain in our wallets for much longer than before, and we get impatient when someone at the front of the coffee line fumbles for currency to pay for their latte. But despite the rise of mobile payments and electronic wallets over the last decade, old-fashioned cash remains the world's most widely used medium of payment.
Electronic and digital transactions are certainly growing. According to the World Payments Report 2017, global non-cash transaction volumes grew 11.2%, the fastest growth rate in the past decade. Card payments are growing in frequency, and include increasing numbers of smaller-value transactions. The average value of a card payment (in nominal terms) has decreased from above $60 in 2000 to around $36 in 2016. Another factor is the rapid rise in online transactions, which cannot be conducted in cash. E-commerce now represents 10.2% of global retail sales up from only about 1% in the year 2000.
 Scandinavian countries, in particular, are leading the progress towards cashless societies. In Sweden, trust in the payments system is high and smartphone tools facilitating payments have proliferated. Swedish drinkers can buy beers in a bar without queuing, and their banks allow them to repay debts to friends with an app.
In emerging markets, more people are holding credit or debit cards, and the availability of point-of-sale terminals is expanding. In some countries, the adoption of mobile wallets has rapidly overcome obstacles that limit the attraction of cash-based financial infrastructure.
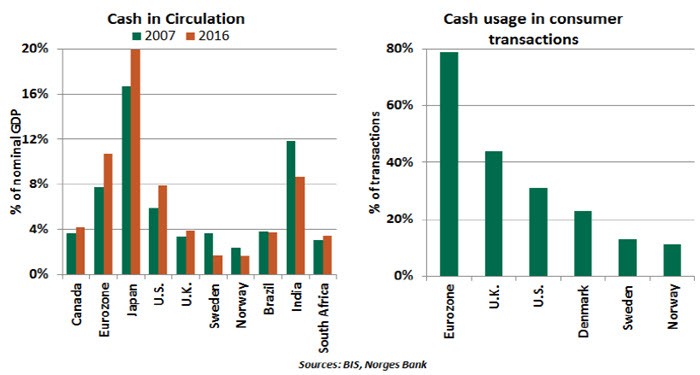
Despite all of this, the amount of cash in circulation has risen from 7% to 9% of gross domestic product (GDP) since the year 2000 in a sample comprising 46 countries. The rise was particularly high in developed markets following the financial crisis.
The increased demand for cash around the Great Recession had several drivers. It is a store of value, and that value increases when trust in financial institutions erodes. Low interest rates reduced the opportunity cost of carrying cash, which pays no interest. Ageing is also a factor, as older people have an affinity for cash. For example, the aging population of Japan has the highest relative amount of cash in circulation among major economies, at 20% of GDP.
The conventional wisdom is that cash is popular to facilitate illegal activity and to evade taxes. The use of physical U.S. dollars or euros in markets where the local currency is less reliable is also a factor supporting the demand for currency.
The volume of large-denomination banknotes in circulation can be used to assess the scale of this activity, as these are generally not used for smaller transactions. In Europe, the sustained demand for high denomination notes raises suspicion. The €500 note (production of which stopped this year) accounts for over 30% of the value of banknotes in circulation, but in a 2011 survey, 56% of European Union citizens reported never having seen such a note. We can only assume who has laid eyes on these bills.
From the eurozone to Venezuela to India, policymakers have tried to limit the use of cash to widen the tax base. Central banks would certainly prefer a faster transition to electronic payments; the usage of cash involves costs for printing, storing and moving bank notes and coins.
Most forecasters expect the usage of cash will decline in the years ahead, but that same prediction was offered a decade ago. The allure of hard currency may be more timeless than previously thought.
A Side Hustle in Labor Statistics
U.S. economic statistics are current and comprehensive, but their construction has generally been fixed while the economy has been variable. Employment statistics illustrate the challenge of keeping up with modern economic forces.
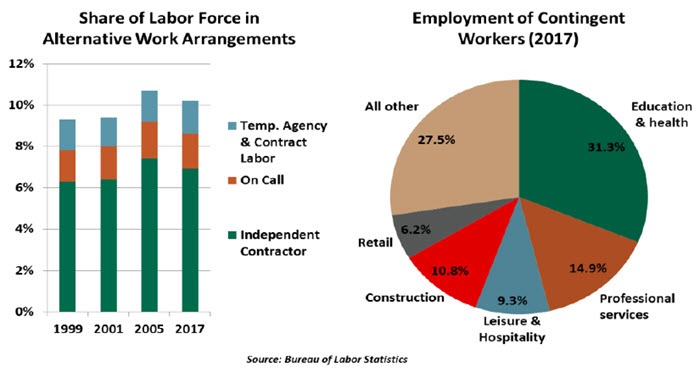
The Bureau of Labor Statistics (BLS) recently published an update to its Contingent Worker Survey (CWS) for the first time since 2005. The CWS seeks details about contingent workers (those who do not expect their positions to be permanent) and alternative employment (less-predictable jobs like contractors, on-call workers, and temporary help). 5.9 million U.S. workers are estimated to hold contingent jobs, and more than 15 million work in alternative employment arrangements. The classification can feel like a riddle: a job may be considered contingent, alternative, both or neither.
We expected this year's survey to reflect the "gig economy"—task-oriented work that involves connecting workers to employers through technology platforms. Workers have gained ample opportunities to turn their spare time and resources (like the empty seats of their cars and empty rooms in their homes) into money-making opportunities. There were no ride-sharing platforms in 2005; since then, the number of ride-share drivers has increased from zero to millions. These jobs meet the definition of alternative work arrangements. However, the survey revealed that the share of the labor force performing alternative work has not grown.
 Concepts in the CWS don't align with modern employment arrangements. Although a gig worker is considered an independent contractor, such work is not typically that person's primary job. Gig workers with a primary job are counted as conventionally employed; additional time spent in an alternative source of work is not reflected in the employment survey.
We have not lost hope for better resolution of the modern labor market. Newly in 2017, the survey asked questions about whether the worker had taken any short tasks or jobs through an app. Results from these new questions will be published in September 2018.
Our interest in improved jobs data is more than academic. We can't tell whether the labor market has reached capacity without a robust understanding of how workers are participating in the economy. In this respect, side hustle data is like side hustle income: though richer and more frequent data would be ideal, any information is better than none.
The information herein is based on sources which The Northern Trust Company believes to be reliable, but we cannot warrant its accuracy or completeness. Such information is subject to change and is not intended to influence your investment decisions.
Recommended Content
Editors’ Picks
EUR/USD edges lower toward 1.0700 post-US PCE

EUR/USD stays under modest bearish pressure but manages to hold above 1.0700 in the American session on Friday. The US Dollar (USD) gathers strength against its rivals after the stronger-than-forecast PCE inflation data, not allowing the pair to gain traction.
GBP/USD retreats to 1.2500 on renewed USD strength

GBP/USD lost its traction and turned negative on the day near 1.2500. Following the stronger-than-expected PCE inflation readings from the US, the USD stays resilient and makes it difficult for the pair to gather recovery momentum.
Gold struggles to hold above $2,350 following US inflation

Gold turned south and declined toward $2,340, erasing a large portion of its daily gains, as the USD benefited from PCE inflation data. The benchmark 10-year US yield, however, stays in negative territory and helps XAU/USD limit its losses.
Bitcoin Weekly Forecast: BTC’s next breakout could propel it to $80,000 Premium

Bitcoin’s recent price consolidation could be nearing its end as technical indicators and on-chain metrics suggest a potential upward breakout. However, this move would not be straightforward and could punish impatient investors.
Week ahead – Hawkish risk as Fed and NFP on tap, Eurozone data eyed too

Fed meets on Wednesday as US inflation stays elevated. Will Friday’s jobs report bring relief or more angst for the markets? Eurozone flash GDP and CPI numbers in focus for the Euro.