The Fed is hiking to normalize, not to pre-empt inflation
Outlook:
Crashing oil prices are weighing on fixed income yields and equities, but it's not clear why it should weigh on the dollar--unless you think the Fed could stay its hand on the next hike because falling oil prices imply falling inflation. But the Fed is not hiking to pre-empt inflation. It's hiking to normalize.
It's a structural event, not a cyclical one. It's not realistic to think inflation could go so low that the Fed will defer the next hike, not when employment is full. If unemployment were to jump, maybe we could consider delay, but that would be an extreme scenario.
Anyone speaking of recessionary conditions in the US today is talking through his hat. The choice is not between robust growth and recession. The choice is between slow growth and slower growth. But it's still growth. We will get a small contribution to this stance with today's unemployment data, not usually a mover-and-shaker but perhaps soothing some savage breasts.
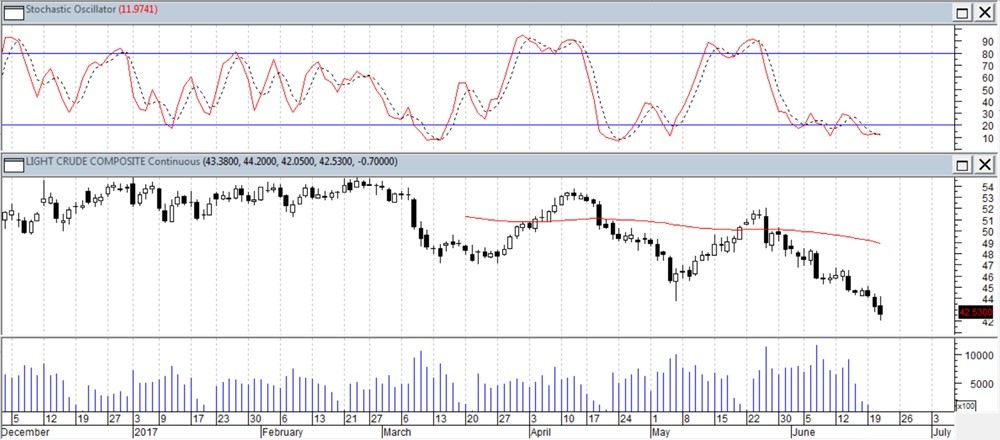
Besides, oil may be bottoming. Talk of $35 is probably overdone in the first place. Forecasts like to draw extension lines (we admit it, we do, too), but they forget that at some point, traders with actual skin in the game see that the price is oversold. Paring positions can have as big an effect as supply and demand metrics. We have a number of indicators to show oversold and they are all flashing red. After the descent into bear market territory, what if today is the day that traders scare themselves into retreat? See the chart (WTI continuous) on the next page. The price is well under the 100-day moving average. But volume has peaked. The stochastic oscillator in the top window shows oil seriously oversold. Note what has happened the last few times we had this condition.
We are not forecasting a recovery in oil prices. But we are saying that drawing conclusions about US inflation and the behavior of the Fed from oil prices is going too far. As soon as the price returns to the mean, and let's call the mean the 100-day ($48.92), all this talk of oil staying the Fed's hand will vanish in a puff of smoke. It would be nice if one of the Fed speakers would come right out and say so. In other words, markets can be wrong. We say the market showed itself wrong again on the housing story. Ahead of the data, the mood was negative. Falling home sales in April led to a forecast of falling sales in May, too. Everyone forgot sales had hit a 10-year high in March, so the April pullback was not all that big a deal. Forecasters had expected a small dip in May, but instead sales rose 2.1% for an an-nual rate of 5.62 million, or 2.7% y/y. It's the third highest rate in 10 years.
The National Association of Realtors comes right out and says there is a housing shortage and the solu-tion is to build more. The NAR has some evidence on its side, too. Prices are up 5.8% y/y and the me-dian price is now $252,800. Supply is a mere 4.2 months and inventory has fallen for two straight years. The average time on the market is only 27 days, the shortest since this measure was started 6 years ago. It's a seller's market.
Ahead of the release, sentiment was negative—wannabe millennial buyers were seen as too savvy to overpay and risk their net worth like those who got hosed in the 2008-09 meltdown. Now it seems that they may be too savvy to overpay for McMansions, but they are still buying—just downmarket. De-mographics are central. Baby boomers are downsizing, which makes the slowdown in apartment/condo construction a little puzzling. If millennials are buying the old Boomer houses, buy stock in Home De-pot and Lowes. The market is unimpressed by the new data, but we think housing is a key issue that may develop in some unexpected ways.
The third place markets are getting it wrong is the UK. To be sure, Haldane saying accommodation should perhaps be ending later this year was a bombshell, but the bigger story is the near 4-4 note in the Monetary Policy Committee. We had a similar situation when Volcker was Fed chairman and his Board disagreed with him. The saga was told at length in the many heavy tomes about the Fed that emerged right after his tenure. The result was Volcker's resignation, because the Fed chief should al-ways have the confidence of his board. This is not to suggest Carney will resign, but it is to show deep cracks in central bank management. You either believe your data—2.9% inflation well over the 2% target—or you admit to "exceptions" to the policy rule.
In this case, Brexit may indeed provide the exception, and it's altogether plausible that the slowdown about to hammer the UK economy does deserve whatever scraps of stimulus that QE continues to pro-vide. But it's also true that dissension at the BoE combined with a shaky government and the absence of a coherent Brexit plan makes it three strikes. We are a long-term sterling bear but as events showed yesterday, you can have the analysis dead right and still lose your shirt.
We are hewing to the stronger dollar scenario but wish we could get some data validation for it.
Note to Readers: RTS has launched a Trade Copier service. We place our trades from the Afternoon Traders' Advisory in the retail spot market and your MT4 account mirrors the trades taken in the RTS account. You don't have to lift a finger. You get to pick how much leverage and exactly which curren-cies you want to include. If you are interested, please contact Paul Harris at [email protected] or visit http://www.rtsforex.com/trade-copier/.
| Currency | Spot | Current Position | Signal Date | Signal Strength | Signal Rate | Gain/Loss |
| USD/JPY | 111.24 | LONG USD | 06/21/17 | STRONG | 111.09 | 0.14% |
| GBP/USD | 1.2667 | SHORT GBP | 06/12/17 | STRONG | 1.2701 | 0.27% |
| EUR/USD | 1.1162 | SHORT EURO | 06/12/17 | WEAK | 1.1218 | 0.50% |
| EUR/JPY | 124.13 | SHORT EURO | 07/08/17 | WEAK | 123.65 | -0.39% |
| EUR/GBP | 0.8811 | LONG EURO | 04/25/17 | STRONG | 0.8490 | 3.78% |
| USD/CHF | 0.9739 | LONG USD | 06/12/17 | WEAK | 0.9675 | 0.66% |
| USD/CAD | 1.3304 | SHORT USD | 05/17/17 | STRONG | 1.3621 | 2.33% |
| NZD/USD | 0.7260 | LONG NZD | 05/30/17 | STRONG | 0.7062 | 2.80% |
| AUD/USD | 0.7549 | LONG AUD | 06/08/17 | STRONG | 0.7548 | 0.01% |
| AUD/JPY | 84.01 | LONG AUD | 06/16/17 | WEAK | 84.65 | -0.76% |
| USD/MXN | 18.1437 | SHORT USD | 05/17/17 | STRONG | 18.7098 | 3.03% |
This is an excerpt from “The Rockefeller Morning Briefing,” which is far larger (about 10 pages). The Briefing has been published every day for over 25 years and represents experienced analysis and insight. The report offers deep background and is not intended to guide FX trading. Rockefeller produces other reports (in spot and futures) for trading purposes.
To get a two-week trial of the full reports plus traders advice for only $3.95. Click here!
Author

Barbara Rockefeller
Rockefeller Treasury Services, Inc.
Experience Before founding Rockefeller Treasury, Barbara worked at Citibank and other banks as a risk manager, new product developer (Cititrend), FX trader, advisor and loan officer. Miss Rockefeller is engaged to perform FX-relat


