The dollar printed its lowest point the preceding week on Thursday

The Dollar
The dollar printed its lowest point the preceding week on Thursday, day 54. The dollar has since formed a swing low and closed consistently above the 10 day MA signaling a new daily cycle.
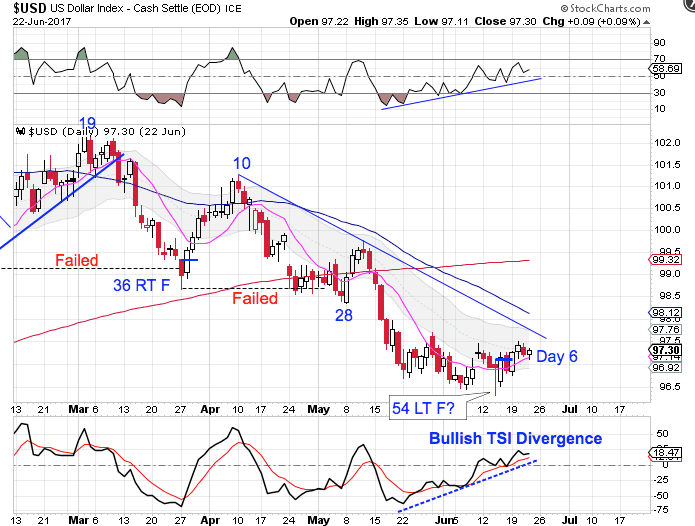
The dollar still needs to close above the declining trend line to confirm that Friday was day 6 of the new daily cycle. The dollar is in a daily down trend & will continue until it closes above the upper daily cycle band.
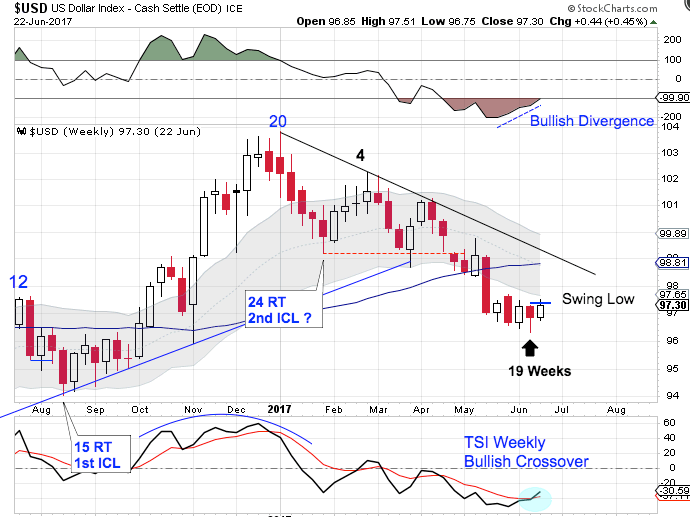
The dollar printed its lowest point the previous week, following the week 4 peak. 19 weeks places the dollar in its timing band for an ICL. The dollar has formed a weekly swing low. Confirmation of a the new daily cycle will indicate that the dollar is also in a new intermediate cycle. A break above the declining weekly trend line will confirm the new intermediate cycle. The dollar is in a weekly downtrend & will continue in its downtrend until it can close above the weekly daily cycle band.
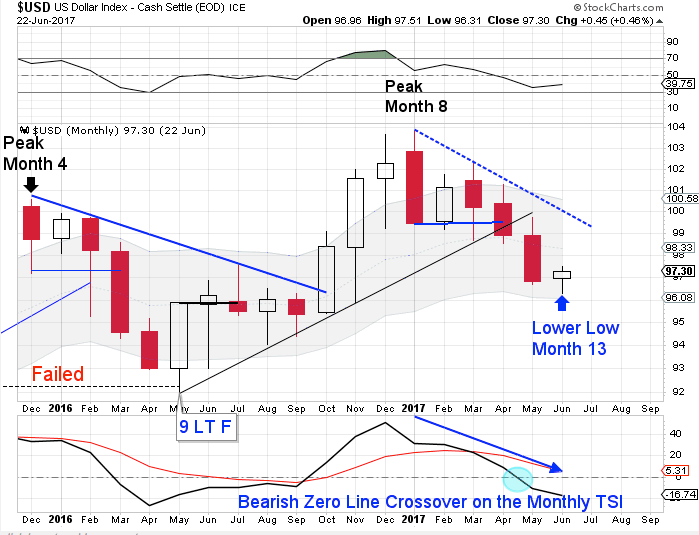
June is month 13, placing the dollar in its timing band to print a yearly cycle low. The bullish monthly reversal candle that is forming will ease the parameters for forming a monthly swing low. Since the dollar has printed a lower monthly low in June, the earliest a monthly swing low can now form will be in July.
The dollar printed a failed yearly cycle in May, 2016 to confirm the 3 year cycle decline. Then the dollar went on to printed a higher monthly high. Since a cycle cannot fail and then print a higher high, this confirms that May, 2016 was an early 3 year cycle low. That makes June, 2017 month 13 for the new 3 year cycle. The dollar has now broke convincingly below the 3 year trend line, indicating that start of the 3 year cycle decline. If that is the case then the subsequent yearly cycles should form as left translated yearly cycles until the 3 year cycle low forms. And if the 3 year cycle decline has begun, then it is setting up as a left translated 3 year cycle. That aligns with our 15 year super cycle analysis.
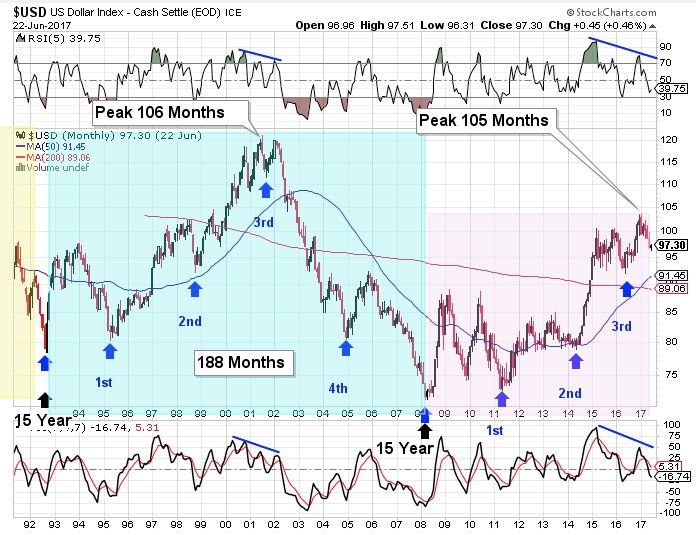
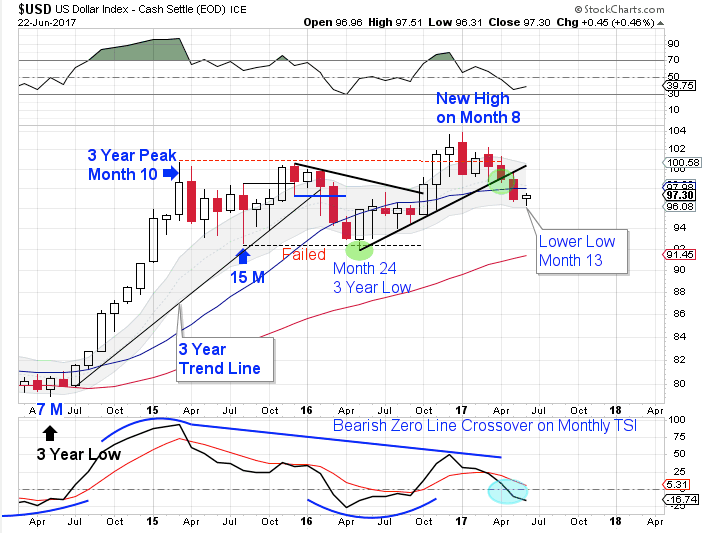
The dollar cycles through a 15 year super cycle. Each 15 year super cycle is embedded with five 3 year cycles. The dollar’s last 15 year super cycle peaked in 2001 on month 106, then declined into its third 3 year cycle low. There are some similarities developing to the current set up. Currently, the dollar has printed a new high in January, which is month 105 for the 15 year super cycle. Which is about when the previous super cycle rolled over into its 15 year super cycle decline. At the previous super cycle peak the dollar was quite stretched above the 200 month MA as well as the 50 month MA — as it is right now. There are bearish divergences developing on the momentum indicators that also appeared at the previous 15 year super cycle peak.
May, 2016 hosted the 3 year cycle low, which was a shortened 3 year cycle of only 24 months. Since most times cycle balances themselves out, we could be poised for the next 3 year cycle to be a stretched 3 year cycle just as the dollar is ready to begin its 15 year super cycle decline. And a stretched 3 year dollar cycle decline would align with gold beginning a new multi year bull cycle.
Stocks
Stocks peaked on Monday, day 21. Stocks formed a swing high on Tuesday then breached the daily cycle trend line on Friday setting up for a daily cycle decline.
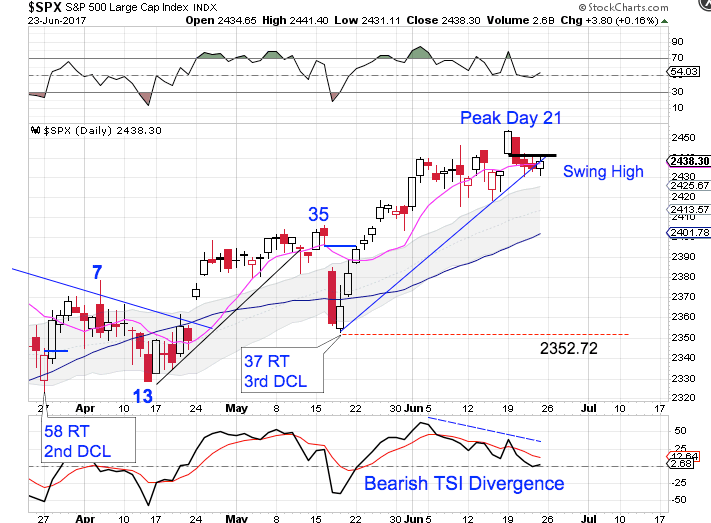
Friday was day 25, placing stocks 5 days shy of their timing band for a daily cycle low. A clear and convincing break of the daily cycle trend line is needed to confirm the daily cycle decline. The peak on day 21 shifts the odds toward a right translated daily cycle formation. However, due to the status of the intermediate cycle I believe that the current daily cycle is still at risk of forming as a left translated, failed daily cycle. A break below the previous daily cycle low of 2352.72 forms a failed daily cycle, which confirms that the intermediate cycle is in decline.
The huge Selling on Strength number from Friday supports this possible scenario.
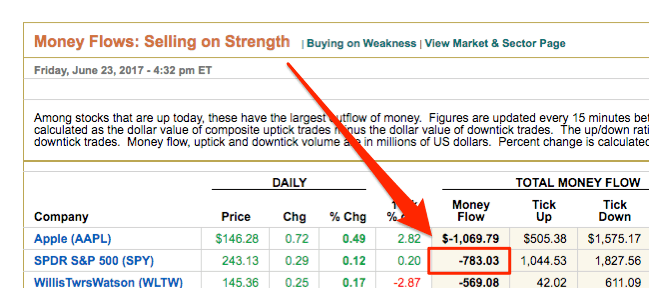
Stocks printed 783 million SOS on Friday. This is the type of SOS number that is associated with an intermediate cycle top.
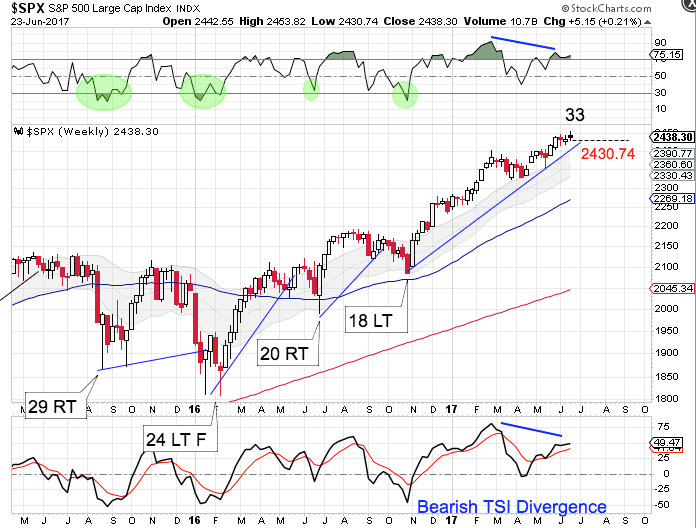
This is week 33 for the intermediate cycle. The weekly cycle is stretched and overdue for an intermediate cycle decline. There are bearish divergences developing on the weekly oscillators which often precede an intermediate peak. At this point confirmation of the daily cycle decline should trigger the intermediate cycle decline as well. A weekly swing high along with a break of the weekly trend line will confirm the intermediate cycle decline. A break below 2430.74 forms a weekly swing high. Still, stocks are in a weekly uptrend and will remain so until they close below the lower weekly cycle band.
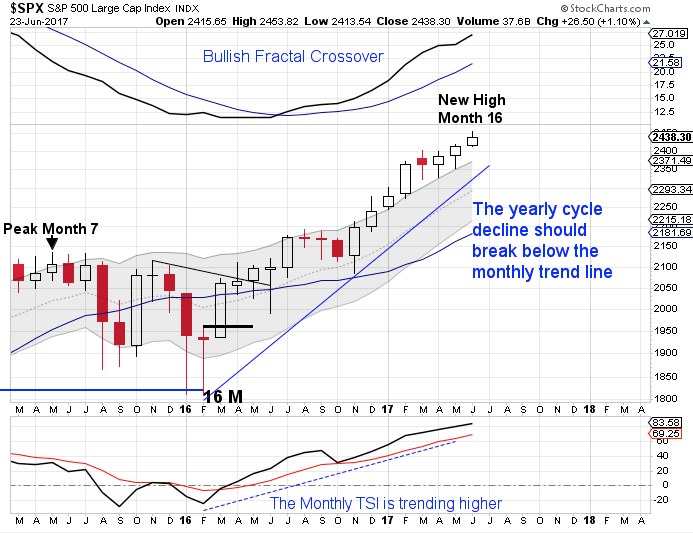
May is month 16 for the yearly equity cycle. The new high locks in a right translated yearly cycle formation. Stocks are deep in their timing band for seeking out their yearly cycle low. A monthly swing high accompanied by a break of the monthly trend line will confirm the yearly cycle decline. Since stocks printed a higher high in June, the earliest a monthly swing high can form will be in July.
Author

LikesMoney
Independent Analyst
Assets (such as stocks, gold, and the dollar) have identifiable cycles.


