The Debt Ceiling: Everything You Need to Know
Executive Summary
The U.S. Treasury is currently utilizing extraordinary measures to create additional borrowing capacity for the federal government as it operates up against the $22 trillion debt limit. Eventually, these measures will be exhausted, and our current baseline projection is that they will be exhausted sometime early in October, though we think there is a risk they could run out in late August instead.
We expect that the debt ceiling will be eventually resolved in time to prevent a default. That said, a technical or de facto default, should one occur, would have destabilizing financial market and economic implications. A fiscal fumble from policymakers in Washington, D.C. represents a risk to the economic outlook later this year. In this report, we take a dive into what the debt ceiling is, how long the Treasury can maneuver while up against it and what might happen in a brush with default.
First Things First: What Is the Debt Ceiling?
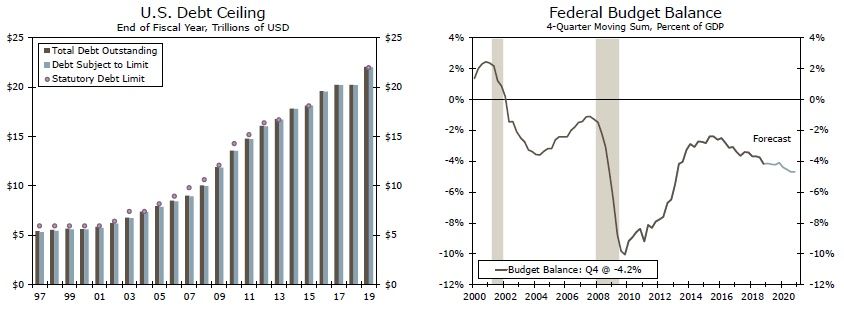
In short, the debt ceiling is a statutory limit on the borrowing authority of the federal government. Thus, when the debt ceiling is set to roughly $22 trillion as it is now, total public debt cannot rise above that number (hence the "ceiling", Figure 1). Since the United States has for the most part run budget deficits in recent history (Figure 2), the debt ceiling periodically has to be raised in order to accommodate additional borrowing by the federal government. Why does the debt ceiling even exist in the first place? Prior to 1917, Congress had to approve each individual offering when the Treasury needed to issue debt, right down to the interest rate offered. When the United States decided to enter World War I, this method of debt issuance became unwieldy, so Congress created the debt ceiling to give the Treasury more discretion while also ensuring that the legislative branch retained a degree of control over how much could ultimately be borrowed.
When Congress increases the debt ceiling, it essentially has two options: it can raise the debt ceiling to a specific number, creating a specific dollar amount of headroom for an indefinite amount of time, or it can simply suspend the debt ceiling until some future date, creating an unspecified amount of headroom for a definite amount of time. When policymakers follow the second route, as they have frequently done of late, the debt ceiling is reinstated on a specified date at whatever dollar amount of public debt prevails on that day. Most recently, on February 9, 2018, Congress suspended the debt ceiling until March 1, 2019. After this period elapsed, the statutory debt limit was permanently increased $21.99 trillion, or the amount of public debt outstanding on March 2.
Ostensibly, when the debt ceiling is reinstated, it should quickly become a hard deadline because the government runs a budget deficit. With a debt ceiling in place, the Treasury could not last very long before its negative cash flow would burn through the cash on hand. This is where the "extraordinary measures" come into play. When Congress fails to lift the borrowing limit, the Treasury utilizes a set of "extraordinary measures" to temporarily keep the nation under the borrowing limit, primarily by halting investments in select government funds.1 By halting these investments, headroom is created under the cap, permitting the Treasury to borrow from the public.
How Long Do Extraordinary Measures Last?
With extraordinary measures available, the true "X date", or when the Treasury would be unable to meet all of its obligations on time, lies at some later date from when the debt ceiling is actually hit. But how long can these extraordinary measures last? This is the magic question tackled by public and private analysts alike each time a debt ceiling deadline approaches. Estimating how long the Treasury can operate while constrained by the debt ceiling is essentially a function of three things: the cash on hand the Treasury has when the debt ceiling is reinstated, the size of the extraordinary measures available to the Treasury and the Treasury's projected operating cash flow.
When the debt ceiling is suspended, the Treasury is required by law to wind down its cash balance by the day of reinstatement to the level that prevailed when the debt ceiling was suspended, which in this most recent case was about $200 billion. The size of the extraordinary measures available to the Treasury varies depending on the time of year but is usually known with a decent degree of precision. Estimating the government's cash flow is the trickiest piece of the puzzle, as it is subject to considerable uncertainty for a host of reasons, including uncertainty in the economic outlook, policy changes and calendar quirks.
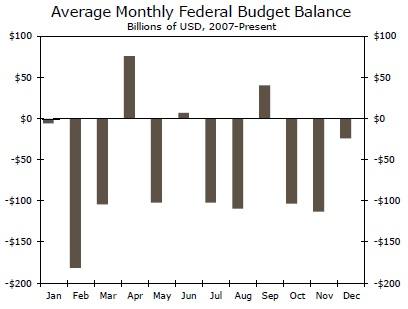
The other key point to understand when forecasting the X date is that the distribution of revenue and outlays is not evenly distributed. Generally speaking, the first and last days of each month often see the largest net outflows due to large payments that are due at that time (Figure 3). For example, payments to Medicare Advantage and Medicare Part D plans are made on the first day of the month and average almost $30 billion. The mid-month period sees the biggest net inflows on average, largely due to individual tax-filing day falling in mid-April and quarterly corporate tax payments falling in mid-January, April, June, September and December (for any given company, the specific four quarters depend on that company's fiscal year). Thus, once again speaking at a high level, the X date is more likely to fall at the beginning or end of a month than in the middle.

Our analysis of these factors suggests that there are two possible outcomes. The first, and what we consider the most likely outcome, is that the X date falls in the first week of October. The end of tax season has brought the Treasury's cash balance to more than $400 billion, giving it a war chest with which it can finance the budget deficit without resorting to additional borrowing. Corporate tax payments due in June and September should also help the Treasury stay afloat. By the end of September, however, this cash on hand will likely have been mostly exhausted, and large payments due at the start of October/start of the new fiscal year could threaten the government's implicit solvency.
The second outcome, and one we consider less likely but still plausible, is that the X date falls in August, which was our original projection back in January. July and August are "down" months for the federal budget deficit (Figure 4), and the late August/early September period could get tricky as the Treasury tries to remain afloat until the mid-month corporate tax payments are made in September. At this point in time, we think the Treasury will be able to make it through, but any unexpected developments that negatively impact the deficit outlook could be enough to tip the scales. Were the economic outlook to deteriorate significantly, for example, weaker tax collections and larger outlays could lead to a wider-than-expected deficit. Congress also continues to wrangle over a disaster spending bill for a variety of recent natural disasters. If the total were to be significantly higher than expected, this could also change the X date outlook.
Congress could of course increase the debt ceiling well before then, eliminating the need for any debt ceiling brinksmanship. Based off of the timing of the X date projections, however, it appears increasingly likely the debt ceiling will be tied to the FY 2020 budget process. FY 2020 begins on October 1, and lawmakers still need to set top-line spending levels and pass the bills appropriating the money. As a result, the budget fight and the debt ceiling may all be tied together come September. As always, we will update our readers should anything occur that would materially change our outlook.
What Happens in a Brush with Default?
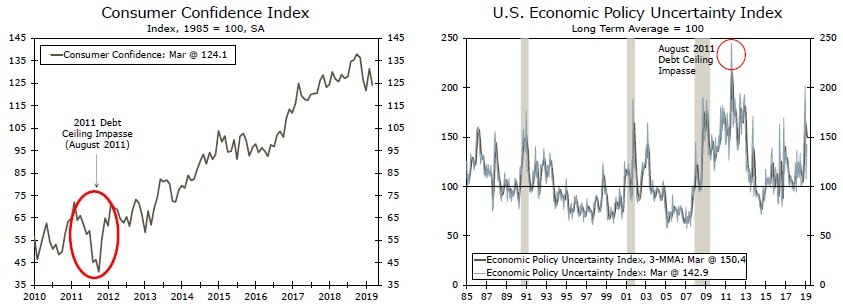
The August 2011 debt ceiling showdown was perhaps the closest brush the United States has had with the X date. During that period, the U.S. Treasury projected that the X date would fall on August 2, and it was on that day exactly that Congress passed and President Obama signed a bill into law increasing the debt ceiling. Consumer confidence weakened significantly during the debt ceiling showdown (Figure 5), and a closely watched measure of U.S. economic policy uncertainty touched its highest level on record (Figure 6). Although it is difficult to parse out how much, if at all, the debt ceiling impasse was to blame, it is worth noting that real GDP growth was an especially weak -0.1% on a quarter-over-quarter annualized basis in Q3-2011.
A key question that comes up each time a hard debt ceiling deadline looms is whether or not the Treasury could prioritize payments, specifically whether it could prioritize principal and interest payments on Treasury securities to avoid a technical default.2 To this day, the jury is still out on whether this is legally or technically possible. The debate goes back as far as the mid-1980s, when the Treasury and the Government Accountability Office (then called the General Accounting Office) disagreed over whether Treasury must make payments on obligations as they come due. It has been the general custom of Treasury officials to squash the notion that prioritization is a viable option.
Most recently, Treasury Secretary Steven Mnuchin told lawmakers he had "no intent" to prioritize certain government payments and delay others if Congress fails to raise the debt ceiling.3
A 2012 report by the Council of Inspectors General on Financial Oversight (CIGFO) on the previous year's debt ceiling debacle noted that "Treasury officials determined that there is no fair or sensible way to pick and choose among the many bills that come due every day. Furthermore, because Congress has never provided guidance to the contrary, Treasury's systems are designed to make each payment in the order it comes due."4 In 2014, however, Treasury Assistant Secretary Fitzpayne stated in a letter that "if the debt limit was reached and sufficient cash was available, the Federal Reserve Bank of New York would be technologically capable of continuing to make principal and interest payments on the debt."5 The transcripts from a conference call among Federal Reserve officials on August 1, 2011 suggest that prioritization was seriously under consideration at the time, and that from a technological standpoint, the bigger concern was about the capabilities of the New York Fed's counterparties rather than the New York Fed itself.6
In short, should the X date come to pass without a debt ceiling resolution, it is not exactly clear what the Treasury would do or whether such a prioritization plan could be executed without a glitch. Even though Treasury officials have tried to stress that prioritization is not a viable option, it does appear the option has been studied and discussed as a "break the glass" option in an emergency. Setting aside the legal and technical challenges, the political repercussions would likely be tremendous. Choosing to pay bondholders would delay payments due to other recipients of federal spending. And even if prioritization were utilized, it is not immediately clear to us that making principal and interest payments on time would be enough. Under a prioritization scenario, the federal government would still be unable to meet all of its obligations on time, and financial market participants may not distinguish between a technical and a de facto default.
What might the financial market reaction be to another close call? Given what has happened in past debt ceiling showdowns, we believe that an immediate de-risking in financial markets would occur, which likely would push policymakers rapidly towards a resolution before the consequences of a genuine default in Treasury securities could be felt. Turning back to the 2011 episode, the S&P 500 fell nearly 17% between July 22 and August 8 (Figure 7). The reaction in the Treasury market was a bit more nuanced. Ostensibly, concern about the fiscal outlook and the solvency of the U.S. government should put upward pressure on yields on Treasury securities. The yield on the 10-year Treasury, however, fell 85 basis points between July 28 and August 3, in-line with the significant "risk-off" move that occurred during this stretch. In contrast, yields on very short-dated Treasury securities rose as the near-term risk of owning a security that could be in default caused investors to shift their money elsewhere (Figure 8). During that August 1 conference call of the Federal Reserve Board, Brian Sack, the Manager of the System Open Market Account (SOMA) at the time, noted that:
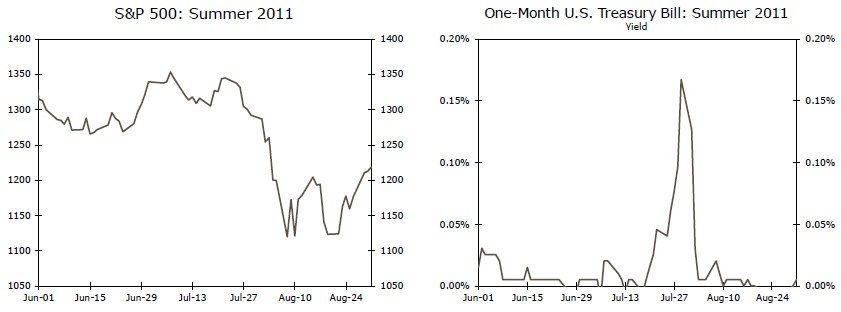
"Money market funds and other market participants began to hoard significant amounts of liquidity. In that process, they moved out of short-term Treasury repo transactions and Treasury bills and into deposits at financial institutions, reflecting their concern that the Treasury markets could become increasingly dysfunctional."7
For financial market participants looking for a port in the storm, it appears the "where to go" question was answered, at least in part, by putting money on deposit at financial institutions.
A related risk for markets would be the possibility of another downgrade of the federal government's credit rating. In the wake of the 2011 debt ceiling episode, Standard & Poor's downgraded the U.S. sovereign credit rating from AAA (its highest rating) to AA+. At the time, the Federal Reserve deliberated about whether this downgrade from the ironclad AAA would force investors to dump Treasuries. The transcript from the aforementioned FOMC conference call noted that "It is difficult to calibrate just how much the market would react to an actual downgrade by S&P. Our judgment is that a move to AA or AA+ rating would not force many investors to have to sell Treasury securities because of their investment mandates."8 On the day of the downgrade, the 10-year yield jumped 15 basis points to 2.56%. Nearly eight years later, however, the yield on the 10-year is nearly identical, suggesting that there are still plenty of investors demanding U.S. Treasuries. Another downgrade, however, could signal that the 2011 episode was not a one-off event to be ignored and could awaken financial market participants to the serious fiscal challenges that lie ahead.
What might be the economic and financial market implications of actually entering a default period? Peering beyond the veil of the X date is to a large extent speculation, since policymakers have always found a way to lift the debt ceiling before the point of insolvency. A default could lead to both voluntary and involuntary selling of Treasuries, leading to a sell-off. Yet, it is not immediately clear where investors could safely turn. To U.S. mortgage-backed securities, which contain an implicit government guarantee? To municipal debt, whose finances are often intertwined with federal grants and loans? Perhaps foreign sovereign debt like German bunds would be the answer, but the outsized U.S. Treasury market, at $16 trillion, dwarfs that of most other countries. The market for German bunds, for instance, is a bit less than $1.5 trillion. As mentioned earlier, U.S. banks saw large deposit inflows during the 2011 episode, but here too the interconnectedness of the financial system shows: a large chunk of these deposits ended up at the Federal Reserve, the fiscal agent of the federal government and the largest U.S. Treasury holder in the world! Such a default scenario, should it come to pass, would likely have significant destabilizing and negative economic consequences for the U.S. and global economies.
Conclusion
Pulling it all together, the U.S. Treasury is currently utilizing extraordinary measures to create additional borrowing capacity for the federal government as it operates up against the debt limit. Eventually, these measures will be exhausted, and our current baseline projection is that they will be exhausted sometime early in October, though we think there is a risk this could occur in late August instead. Congress and the president could act at any point to lift the debt ceiling, but it appears increasingly likely the debt ceiling will be tied to the FY 2020 budget, which may not be resolved for several more months. As a result, it is possible there could be some debt ceiling brinksmanship come the late summer/fall. Should it occur, financial markets could see a significant risk-off move, and the economic disruptions would be another challenge for an expansion that, in a few more months, will be the longest on record.
Author

Wells Fargo Research Team
Wells Fargo


