Technical analysis: GBP/USD rallies from 1-year lows but downside risks remain

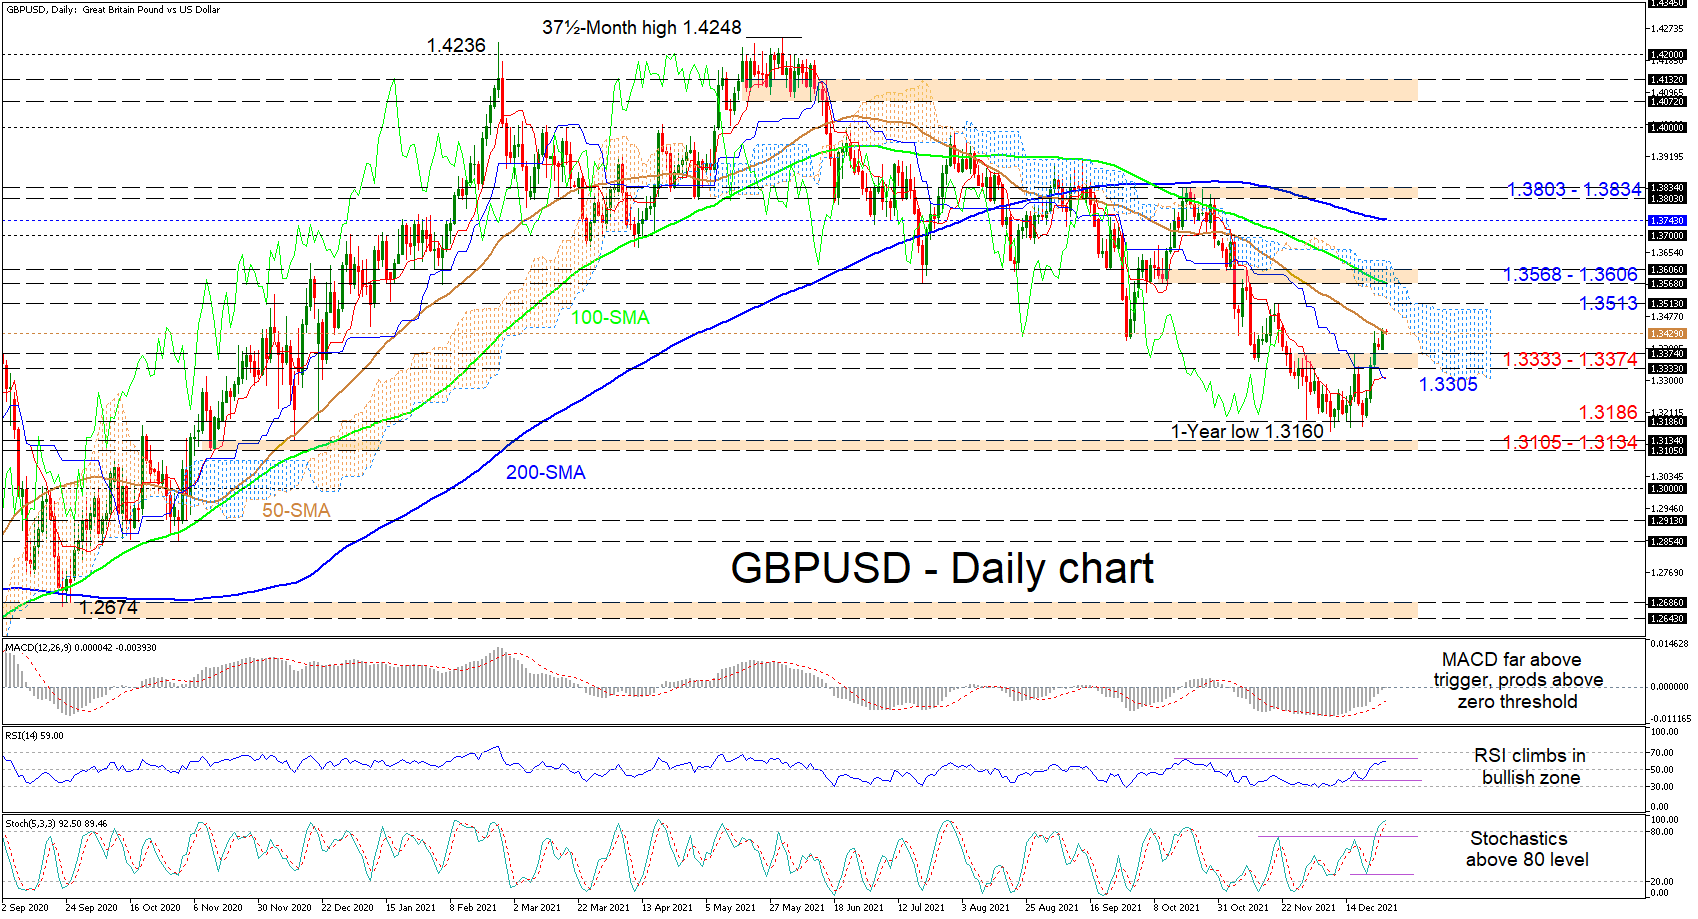
GBPUSD is confronting the falling 50-day simple moving average (SMA) at 1.3429 after buyers powered up around the 1.3186 vicinity, opposing the six-month decline from the more than three-year high of 1.4248. The bearish SMAs are shielding the negative trend in the pair.
That said, the Ichimoku lines are indicating some waning in negative pressures but have yet to confirm that buyers have the upper hand. Looking at the short-term oscillators, they are showing no clear signs that upside drive is weak, suggesting that the bullish momentum is growing. The MACD has distanced itself from its red trigger line and has nudged above the zero mark, while the RSI is improving in the positive region. The stochastic lines are rising in overbought territory promoting positive price action in the pair.
If the pair oversteps the 50-day SMA at 1.3429, preliminary upside obstructions could stem from the Ichimoku cloud and the 1.3513 nearby high. Successfully thrusting higher, buyers may then struggle around the reinforced 1.3568-1.3606 border. Conquering this too may boost upside momentum, encouraging the bulls to tackle a critical zone of resistance between the 1.3700 handle and the 200-day SMA at 1.3743 before reaching for the 1.3803-1.3834 zone of highs from mid-October.
If the 50-day SMA curbs advances, initial footing for the pair could transpire within the 1.3333-1.3374 area. However, should the area fail to provide the necessary support to revive upside impetus, the price drop could snag around the Ichimoku lines at 1.3305 before sliding towards the 1.3186 key boundary, which recently muted negative powers. From here, if sellers manage to plot new lows and overcome the 1.3105-1.3134 support boundary, formed over the November-December 2020 period, the bears could then pursue the 1.3000 hurdle.
Summarizing, GBPUSD is striving to make headways, but the pair’s picture remains skewed to the downside as the price holds beneath the SMAs and the 1.3513 high.
Author

Anthony Charalambous joined XM in 2019 and specializes in preparing daily technical analysis, using his years of trading experience to provide detailed forecasting for all major asset classes such as forex, indices, commodities and equities.


