Tariff Talks Slow Down Markets
US Dollar: Dec USD is Down at 97.725.
Energies: Jan'20 Crude is Up at 56.41.
Financials: The Mar'20 30 year bond is Up 10 ticks and trading at 157.23.
Indices: The Dec S&P 500 emini ES contract is 12 ticks Higher and trading at 3117.25.
Gold: The Feb'20 Gold contract is trading Up at 1472.30. Gold is 31 ticks Higher than its close.
Initial Conclusion
This is not a correlated market. The dollar is Down- and Crude is Up+ which is normal but the 30 year Bond is trading Higher. The Financials should always correlate with the US dollar such that if the dollar is lower then bonds should follow and vice-versa. The S&P is Higher and Crude is trading Higher which is not correlated. Gold is trading Higher which is correlated with the US dollar trading Down. I tend to believe that Gold has an inverse relationship with the US Dollar as when the US Dollar is down, Gold tends to rise in value and vice-versa. Think of it as a seesaw, when one is up the other should be down. I point this out to you to make you aware that when we don't have a correlated market, it means something is wrong. As traders you need to be aware of this and proceed with your eyes wide open.
At this time all of Asia is trading mainly Lower with the exception of the Aussie and Shanghai exchanges which are Higher at this time. Currently Europe is trading Mixed.
Possible Challenges To Traders Today:
-
Wards Total Vehicle Sales - All Day. This is Major.
-
Lack of Major economic news.
Treasuries
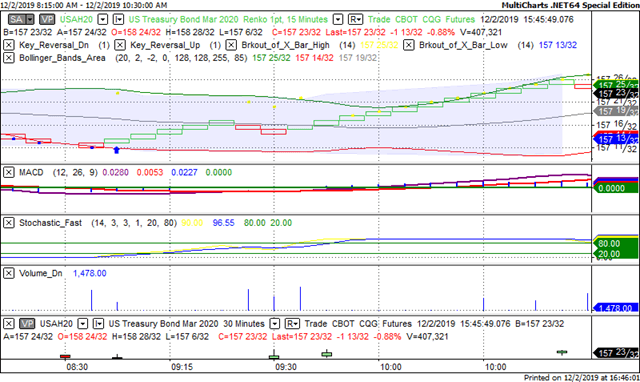
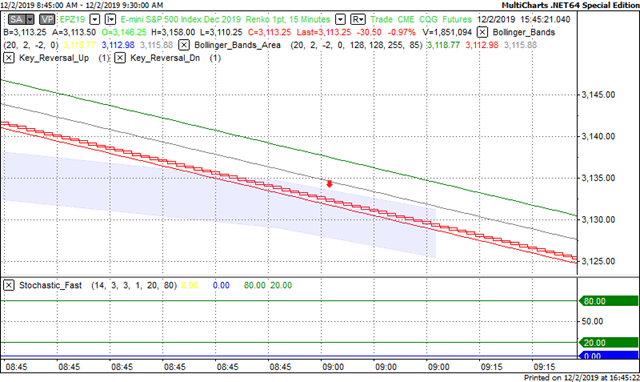
We've elected to switch gears a bit and show correlation between the 30 year bond (ZB) and The S&P futures contract. The S&P contract is the Standard and Poor's and the purpose is to show reverse correlation between the two instruments. Remember it's liken to a seesaw, when up goes up the other should go down and vice versa.
Yesterday the ZB made a major move at around 9 AM EST. The ZB hit a Low at around that time and the S&P continued on a downward spiral. If you look at the charts below ZB gave a signal at around 9 AM EST and the S&P moved Lower at the same time. Look at the charts below and you'll see a pattern for both assets. ZB hit a Low at around 9 AM and the S&P was moving Lower shortly thereafter. These charts represent the newest version of MultiCharts and I've changed the timeframe to a 15 minute chart to display better. This represented a Long opportunity on the 30 year bond, as a trader you could have netted about a dozen ticks per contract on this trade. Each tick is worth $31.25. Please note: the front month for the ZB is now March '20. The S&P contract is still December. I've changed the format to Renko bars such that it may be more apparent and visible.
Charts Courtesy of MultiCharts built on an AMP platform
Bias
Yesterday we gave the markets an Upside bias as both the Bonds and Gold were trading Lower yesterday morning, hence the Upside bias. The Dow dropped 268 points and the other indices lost ground as well. Today we aren't dealing with a correlated market and our bias is Neutral.
Could this change? Of Course. Remember anything can happen in a volatile market.
Commentary
Yesterday the markets appeared to be leaning towards the Upside as both the Bonds and Gold were trading Lower and this usually reflects an Upside day, hence the Upside bias. Additionally all of Asia and Europe traded Higher yesterday morning. However at some point during the morning hours it was announced that President Trump had declared tariffs on imported steel products from Argentina and Brazil. Not too much to speak of those countries aren’t major trading partners. Then it was announced that President Trump said that he would propose tariffs to China if a trade deal wasn’t consummated soon. This set a downward spiral in motion. The Dow dropped 268 points and the other indices lost ground as well.
Author

Nick Mastrandrea
Market Tea Leaves


