![]() Carley Garner
Carley Garner
DeCarley Trading
Treasuries slipped following the 7-year note auction.
We were rooting for a gangbuster auction of $62 billion in US 7-year notes this afternoon, but demand was sluggish. Both the bid-to-cover ratio (how many potential buyers per available securities) and indirect bidders (assumed to be foreign buyers), were both under 12-auction averages.
To be honest, this is a bit of a head-scratcher to us. As we have been beating with a dead horse in this newsletter, yields on the 7 and 10-year notes are now competitive with the S&P 500 dividend yield and US rates are double, or more, that of foreign debt offerings of lower quality (higher default risk). For instance, the US yield on the 10-year note is substantially lower than that of Greece, a country that has defaulted on its debt securities within the last decade.
At some point, the interest rate differential will be recognized on the world finance stage and buyers will show up to acquire US Treasuries. Likewise, as investors begin to realize that stocks can go down, as well as up, we should see a rotation into safer assets such as Treasuries.
Treasury Futures Markets

30-year Treasury Bond Futures
Post-auction rally?
Treasuries have a tendency to find fresh buyers after an anticipated auction. This is partly because the supply of an auction weighs on prices enabling bulls to get in on a discount. Further, auctions are often "sell the rumor buy the fact" events. As long as the ZB holds the 136ish area, the bulls are in control.
From a previous newsletter but still valid: Treasury fund outflows, capitulation selling in futures/TLT, then relief rally or bottom?
Every once in a while, an asset becomes so out of favor the "average Joe" is talking about it. Treasuries, and bonds of most calibers, achieved that status this month. We remember similarly overheated banter as crude oil bottomed under $20 last summer, as the S&P plunged toward 2,200 last March, and the list goes on.
Humans seem to repeat the same emotional patterns throughout time without changing behaviors. We suspect the mass liquidation of Treasury holdings will eventually be looked at as a rare buying opportunity in a decades-long Treasury rally. A break and hold above 157'0 in the 30-year bond should do the trick. Let's see what happens.
Treasury futures market consensus:
The ZB has poked above 157'0 but failed to hold, a close above would be extremely bullish.
Technical Support: ZB: 154'25 ZN: 131'23 and 131'06
Technical Resistance: ZB: 160'0, 161'04, 164'23, 166'16, and 168'22 ZN: 133'01, 133'22, 134'30 and 136'31
Stock Index Futures
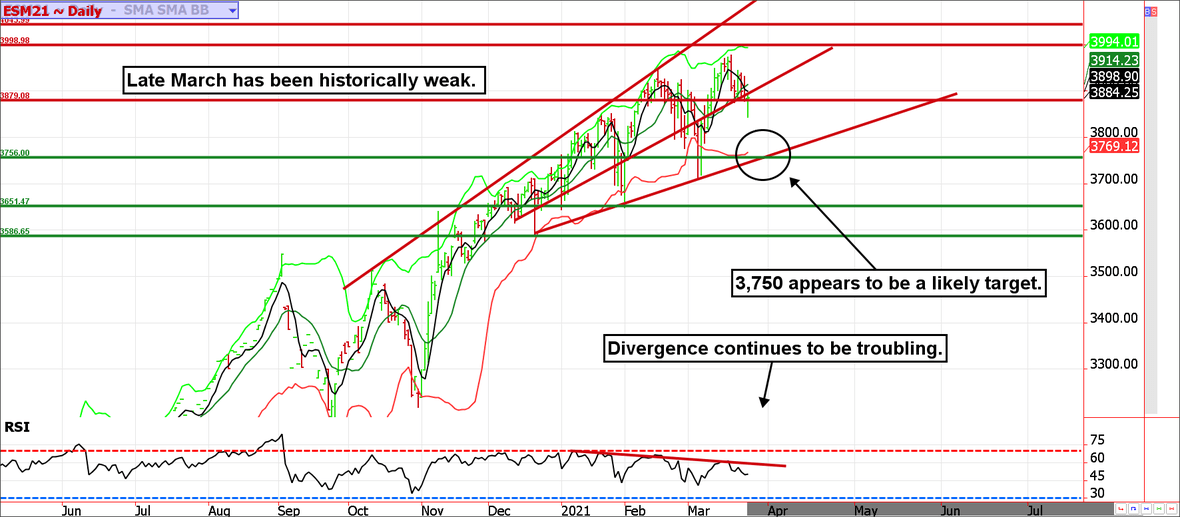
Late March tends to be ugly for stocks. Will the ES see 3,750?
It feels like a move to 3,750 is warranted following a week of waffling trade. The stock market is still quite high on a valuation basis and the rally that began in March 2020 has yet to see a real correction (aside from a temporary pullback in September). We might not necessarily get a deep correction but 10% to 15% is warranted. Further, we are due for a prolonged correction. As large as the March 2020 sell-off was, it was fast; too fast to have caused pain and suffering to long-term investors that didn't watch their retirement accounts like a hawk. Markets are in the business of causing maximum pain, not minimal pain.
The last time we saw the stock market get over its skis to this extreme was 2018 (following the Trump tax cuts). It took almost two years of digestion before the rally resumed to new highs.
Stock index futures market consensus:
3965-3970 is the pivot. The market is bullish above with a target of 4000 to 4040 and bearish below with a target of 3750 (or maybe even 3630).
Technical Support: 3838, 3756, 3651, 3580
Technical Resistance: 4000, 4040, 4105
E-mini S&P Futures Day Trading Levels
These are counter-trend entry ideas, the more distant the level the more reliable but the less likely to get filled
ES Day Trade Sell Levels: 3904 (minor), 3930, 3952, 3994, and 4040
ES Day Trade Buy Levels: 3838, 3787, 3750, and 3710
In other commodity futures and options markets...
January 4 - Go short the BCI (Bloomberg Commodity Index) near 78.6.
January 15 - Buy May ZN 136/137.50 call spread near 38 ticks.
January 28 - Buy May corn 5.10/4.70 put spread.
February 23 - Buy April copper 400/385/370 put butterfly.
February 26 - Buy April hog 88/83 put spread.
March 8 - Buy June crude oil 61/58 put spreads near 85 cents.
March 15 - Roll March BCI into June.
March 23 - Lock in gain on June crude oil put spread.
March 25 - Exit copper spread to lock in moderate gain ahead of expiration.
Due to time constraints and our fiduciary duty to put clients first, the charts provided in this newsletter may not reflect the current session data.
Seasonality is already factored into current prices, any references to such does not indicate future market action.
There is substantial risk of loss in trading futures and options.
These recommendations are a solicitation for entering into derivatives transactions. All known news and events have already been factored into the price of the underlying derivatives discussed. From time to time persons affiliated with Zaner, or its associated companies, may have positions in recommended and other derivatives. Past performance is not indicative of future results. The information and data in this report were obtained from sources considered reliable. Their accuracy or completeness is not guaranteed. Any decision to purchase or sell as a result of the opinions expressed in this report will be the full responsibility of the person authorizing such transaction. Seasonal tendencies are a composite of some of the more consistent commodity futures seasonals that have occurred over the past 15 or more years. There are usually underlying, fundamental circumstances that occur annually that tend to cause the futures markets to react in similar directional manner during a certain calendar year. While seasonal trends may potentially impact supply and demand in certain commodities, seasonal aspects of supply and demand have been factored into futures & options market pricing. Even if a seasonal tendency occurs in the future, it may not result in a profitable transaction as fees and the timing of the entry and liquidation may impact on the results. No representation is being made that any account has in the past, or will in the future, achieve profits using these recommendations. No representation is being made that price patterns will recur in the future.
Due to the volatile nature of the futures markets some information and charts in this report may not be timely. There is substantial risk of loss in trading futures and options. Past performance is not indicative of future results. The information and data in this report were obtained from sources considered reliable. Their accuracy or completeness is not guaranteed and the giving of the same is not to be deemed as an offer or solicitation on our part with respect to the sale or purchase of any securities or commodities. Any decision to purchase or sell as a result of the opinions expressed in this report will be the full responsibility of the person authorizing such transaction.
Recommended Content
Editors’ Picks
EUR/USD edges lower toward 1.0700 post-US PCE

EUR/USD stays under modest bearish pressure but manages to hold above 1.0700 in the American session on Friday. The US Dollar (USD) gathers strength against its rivals after the stronger-than-forecast PCE inflation data, not allowing the pair to gain traction.
GBP/USD retreats to 1.2500 on renewed USD strength

GBP/USD lost its traction and turned negative on the day near 1.2500. Following the stronger-than-expected PCE inflation readings from the US, the USD stays resilient and makes it difficult for the pair to gather recovery momentum.
Gold struggles to hold above $2,350 following US inflation

Gold turned south and declined toward $2,340, erasing a large portion of its daily gains, as the USD benefited from PCE inflation data. The benchmark 10-year US yield, however, stays in negative territory and helps XAU/USD limit its losses.
Bitcoin Weekly Forecast: BTC’s next breakout could propel it to $80,000 Premium

Bitcoin’s recent price consolidation could be nearing its end as technical indicators and on-chain metrics suggest a potential upward breakout. However, this move would not be straightforward and could punish impatient investors.
Week ahead – Hawkish risk as Fed and NFP on tap, Eurozone data eyed too

Fed meets on Wednesday as US inflation stays elevated. Will Friday’s jobs report bring relief or more angst for the markets? Eurozone flash GDP and CPI numbers in focus for the Euro.