Sterling clocks fresh multi-month peaks Vs. Dollar amidst on-going vaccination progress

Note: Charts provided by Trading View
EUR/USD:
Monthly timeframe:
(Technical change on this timeframe is often limited though serves as guidance to potential longer-term moves)
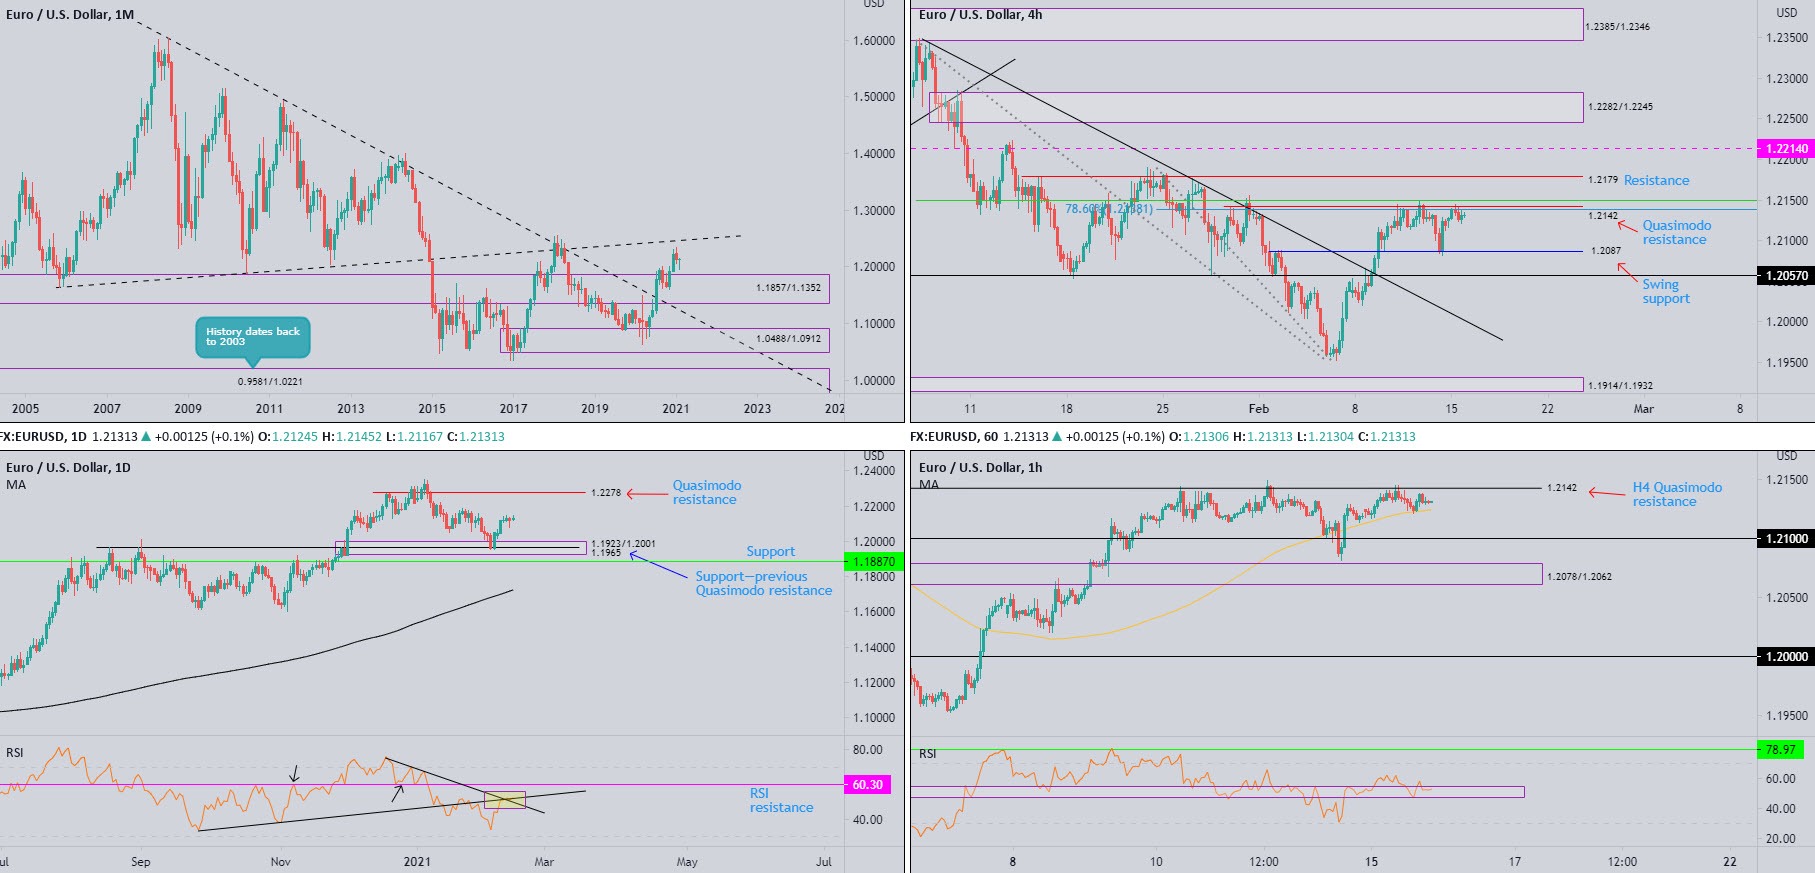
February has so far witnessed a healthy floor of bids emerge around the 1.1950 neighbourhood, consequently stirring a hammer formation (though we will not know this until the month concludes).
Downstream, 1.1857/1.1352 represents demand, while northbound shines light on ascending resistance (prior support – 1.1641).
In terms of trend, the primary uptrend has been in play since price broke the 1.1714 high (Aug 2015) in July 2017.
Daily timeframe:
Partly modified from previous analysis –
EUR/USD continues to consolidate last week’s gains around 1.2130, following a recovery from demand at 1.1923/1.2001—an area housing support at 1.1965 (previous Quasimodo resistance). 1.2190 tops, shadowed by Quasimodo resistance from 1.2278, are seen as possible upside targets.
RSI fans will note the value remains engaging with the 50.00 centreline, which happens to share space with two converging trendline resistances (yellow box).
H4 timeframe:
Outlook unchanged due to lacklustre performance –
Quasimodo resistance at 1.2142—aligning with a 78.6% Fib level at 1.2138 and a 50.0% retracement at 1.2149—remains centre of attention on the H4 scale, withstanding two upside attempts last week. Space north of here may call for resistance at 1.2179, with subsequent buying to possibly take aim at another resistance plotted at 1.2214.
As you can see, Friday also discovered a healthy pocket of bids from swing support recognised at 1.2087, leaving 1.2075 support unchallenged.
H1 timeframe:
Monday had H1 sellers respond from Quasimodo resistance at 1.2142 noted on the H4 scale. H1 buyers also welcomed the 100-period simple moving average at 1.2122. Taking on higher levels may see buyers push beyond what appears to be a consumed H1 Quasimodo resistance at 1.2173 to pursue 1.22 resistance.
47.05/54.20 continues to serve as support out of the RSI indicator, a support/resistance area in play since the beginning of February.
Observed levels:
Outlook mostly unchanged due to lacklustre performance –
Both monthly and daily timeframes ended last week off worst levels, in the shape of a hammer pattern—movement often interpreted as a bullish cue. By the same token, both charts demonstrate room to scale higher, targeting 1.2190 tops on the daily chart.
On the shorter term, H4 Quasimodo resistance at 1.2142, despite blending closely with Fib studies, has failed to invite selling beneath local H4 support at 1.2087. The non-committal tone from sellers, along with H1 holding off the 100-period simple moving average, places a question mark on the H4 Quasimodo formation.
According to chart studies, therefore, H1 buyers could potentially reach for the 1.22 neighbourhood.
AUD/USD:
Monthly timeframe:
(Technical change on this timeframe is often limited though serves as guidance to potential longer-term moves)
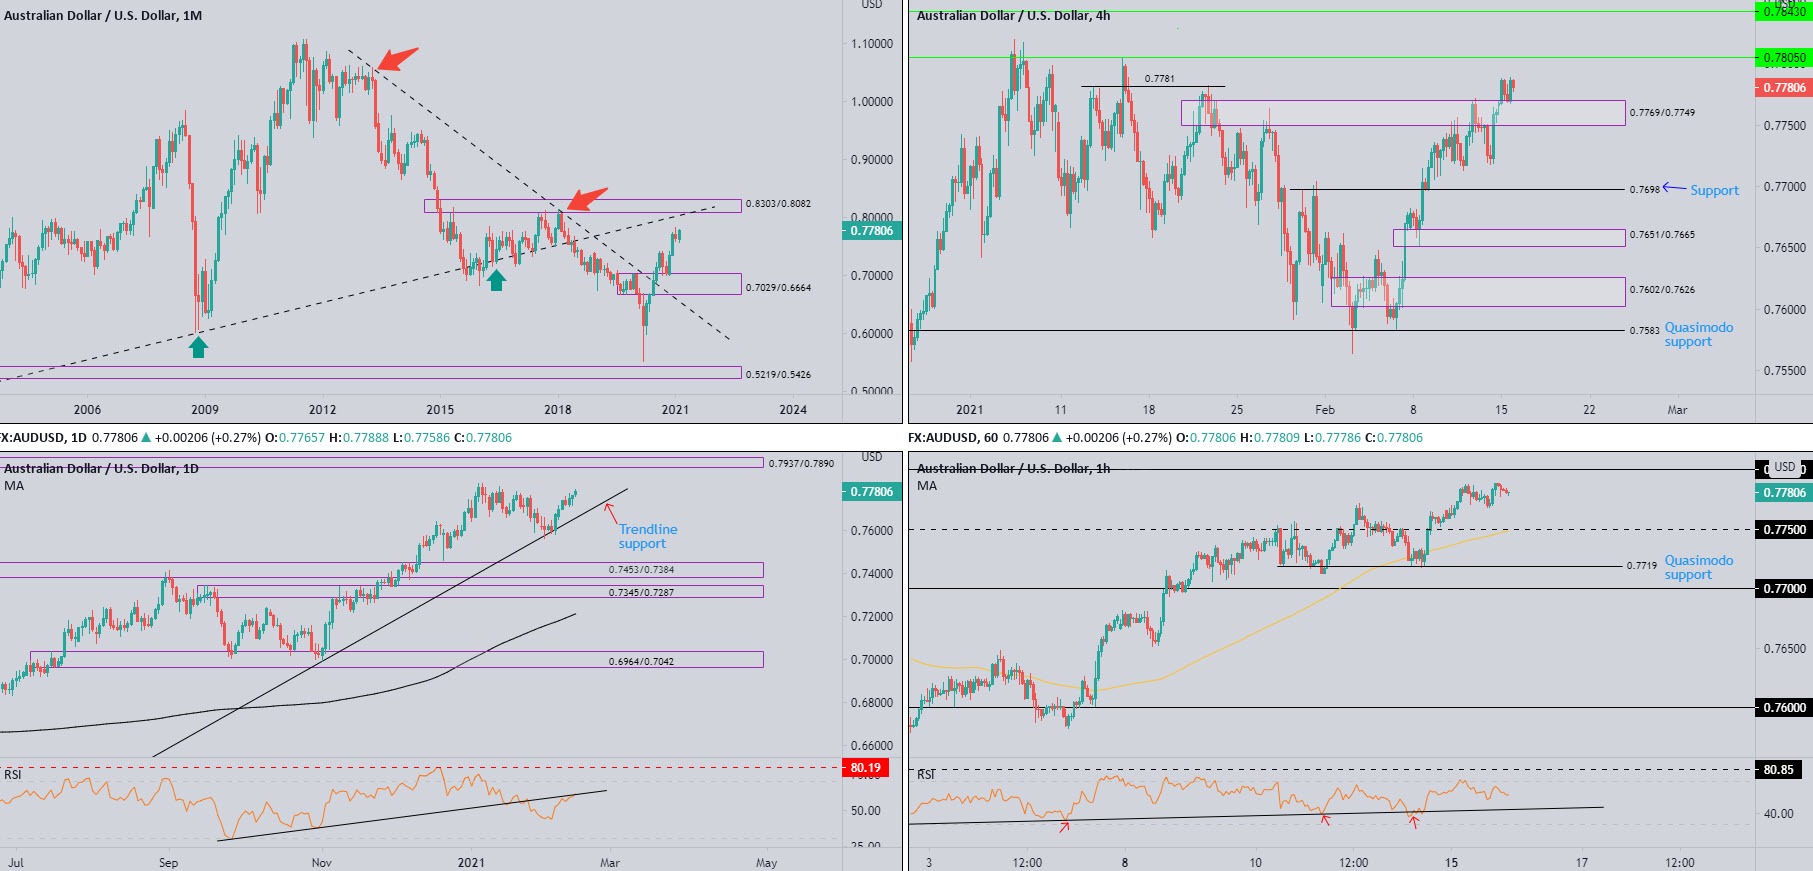
January’s half-hearted shooting star candle (often construed as a bearish indication at peaks) has so far failed to seduce sellers. February, as you can see, trades a touch off session highs, up by about 2 percent.
This brings light to 0.8303/0.8082—a supply zone aligning closely with trendline resistance (prior support - 0.4776). In the event sellers regain consciousness, however, long-term demand resides at 0.7029/0.6664 (prior supply).
In the context of trend (despite the trendline resistance [1.0582] breach in July 2020), the primary downtrend (since mid-2011) remains in play until breaking 0.8135 (January high [2018]).
Daily timeframe:
Partly modified from previous analysis –
Modest USD weakness elevated AUD/USD appeal Monday, recording a third successive daily advance and testing 0.7782 tops.
North of 0.7782, technical elements imply a continuation bid, refreshing 2021 pinnacles and possibly drawing in supply from 0.7937/0.7890. Sellers regaining consciousness, on the other hand, could lead trendline support back into the fight, an ascending level drawn from the low 0.5506.
RSI flow recently dethroned the 50.00 centreline and landed the indicator at RSI trendline resistance, with further upside to possibly touch overbought space.
H4 timeframe:
Bearish flow stepped aside within supply at 0.7769/0.7749 in recent trading, tripping any stops and retesting the upper side of the zone.
Quasimodo resistance plotted at 0.7781 appears to have already been consumed, with continuation moves potentially eyeballing resistance taken from 0.7805.
H1 timeframe:
AUD/USD action was pretty much muted on Monday, despite managing to eke out modest gains on the session.
Upstream, 0.78 psychological resistance resides close by, while lower on the curve, sellers could approach 0.7750 support and the 100-period simple moving average.
Familiar trendline support, taken from the low 23.72, remains in the frame on the RSI, with the value continuing to claw out position north of the 50.00 centreline.
Observed levels:
Partly modified from previous analysis –
The monthly could call for higher levels over the coming weeks, which may lend buyers support on the daily scale and have the pair refresh 2021 highs, with daily supply at 0.7937/0.7890 also to possibly make an entrance.
Across the page on the short-term timeframes, H4 supply at 0.7769/0.7749 was taken out and retested on Monday. This shines the technical spotlight on possible buying today, targeting 0.78 (H1) and 0.7805 resistance on the H4.
The combination of 0.71 and 0.7805 could also attract a short-term correction move, though given higher timeframe flow pointing higher, any moves lower could be short-lived.
USD/JPY:
Monthly timeframe:
(Technical change on this timeframe is often limited though serves as guidance to potential longer-term moves)
Buyers are beginning to show some life on the monthly scale, following January’s bullish engulfing candle.
Resistance can be seen in the form of a descending line (not considered traditional trendline resistance), etched from the high 118.66, whereas follow-through weakness shifts focus to support at 101.70.
Daily timeframe:
Partly modified from previous analysis –
Technical structure to be mindful of:
- The 200-day simple moving average at 105.54 and supply coming in from 106.33/105.78.
- Lower on the curve, demand at 103.56/103.93 is close by, shadowed by trendline resistance-turned support, pencilled in from the high 111.71.
The RSI indicator rebounding from 57.00 support (previous resistance) has elbowed overbought conditions back in sight.
H4 timeframe:
Supply at 105.26/105.14 failed to inspire follow-through selling on Monday and swiftly stepped aside. Trekking higher terrain today, therefore, could be in the offing, taking aim at the alternate AB=CD resistance at 105.63 (the 127.2% Fib extension)—provided a platform for sellers to work with early last week.
The above swings the pendulum in favour of buyers, at least in the short term until we shake hands with 105.63.
H1 timeframe:
Monday observed narrow trading—movement which established a bullish pennant pattern from 105.41 and 105.26. A breakout north unearths a possible drive into Quasimodo resistance at 105.55, a level surrounded by a 161.8% Fib projection at 105.58 and an 88.6% Fib level at 105.61. Beyond here, bullish flow could also approach another Quasimodo resistance at 105.80.
Failure to breakout higher is likely to shift interest to support priced at 105.14, followed by the 105 figure.
The RSI indicator shows the value recently exited overbought waters and is currently hovering around the 65.00 neighbourhood.
Observed levels:
Monthly, daily and H4 timeframes point to a possible breakout above the H1 timeframe’s bullish pennant, targeting at least H1 Quasimodo resistance from 105.55 (aligns with the 200-day simple moving average around 105.53 and the H4 alternate AB=CD resistance at 105.63).

GBP/USD:
Monthly timeframe:
(Technical change on this timeframe is often limited though serves as guidance to potential longer-term moves)
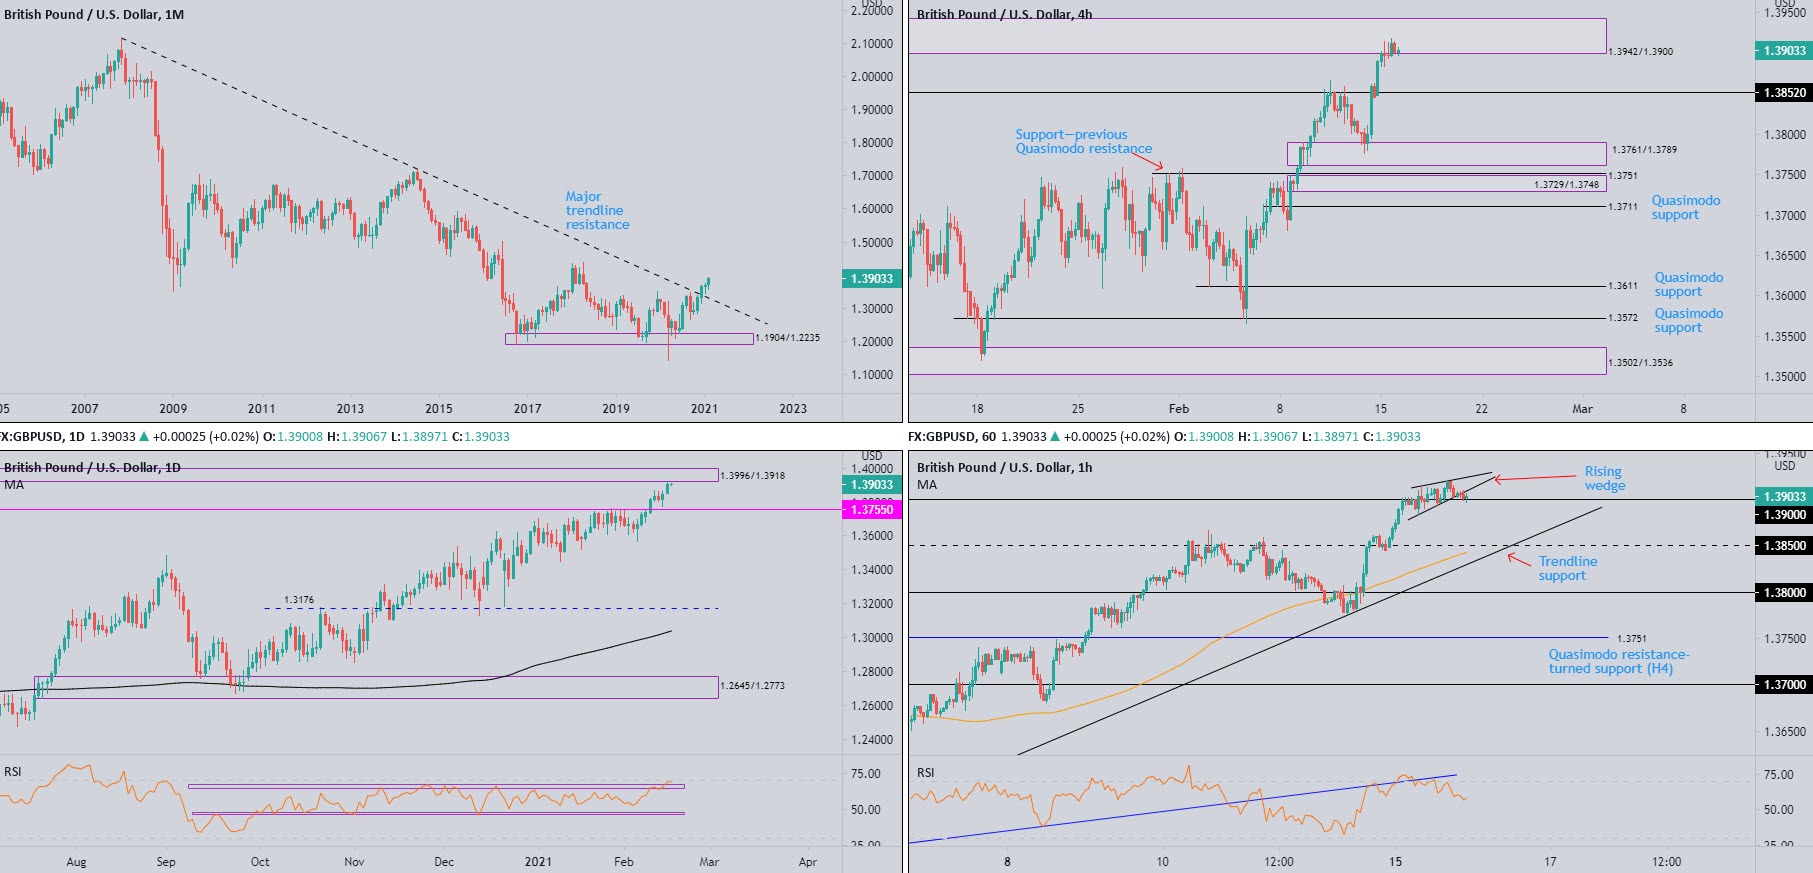
Following December’s 2.5 percent advance—movement that stirred major trendline resistance (2.1161)—February has refreshed multi-month highs at 1.3918.
In terms of trend structure, however, the primary trend has faced lower since early 2008, unbroken (as of current price) until 1.4376 gives way—April high, 2018. In effect, the aforesaid high represents the next upside objective on the monthly chart.
Daily timeframe:
Amidst a modestly softer USD and vaccine optimism out of the UK, GBP/USD welcomed fresh yearly peaks ON Monday and tested supply at 1.3996/1.3918. This follows the break of resistance at 1.3755 earlier last week.
RSI enthusiasts will note the indicator recently broke above the upper edge of a 3-month range between support around 47.00 and resistance at the 66.00 region (the value stands at 68.78), and is on the verge of entering overbought territory.
H4 timeframe:
Monday kicked off on the front foot, lifting the currency pair north of 1.3852 resistance into the walls of supply at 1.3942/1.3900 (glued to the lower side of daily supply at 1.3996/1.3918).
H1 timeframe:
Monday echoed a subdued stance as price forged a rising wedge pattern between 1.3883 and 1.3914 around the 1.39 figure.
As you can see, the lower side of the rising wedge has already given way. Should 1.39 step aside, downside may gain speed and test 1.3850 support, along with nearby trendline support, taken from the low 1.3566.
Observed levels:
Though monthly price appears set to take aim at higher levels, the daily timeframe testing supply at 1.3996/1.3918, along with H4 also testing supply at 1.3942/1.3900, could send H1 south of 1.39 towards the 1.3850 neighbourhood.
Premium
You have reached your limit of 3 free articles for this month.
Start your subscription and get access to all our original articles.
Author

Aaron Hill
FP Markets
After completing his Bachelor’s degree in English and Creative Writing in the UK, and subsequently spending a handful of years teaching English as a foreign language teacher around Asia, Aaron was introduced to financial trading,


