S&P 500 - The Mother Of Bull Traps

The past few weeks recorded an extension of the US equity rally. The S&P 500 index hit the 3,000 figure for the first time since its inception this week. Many market participants turned bullish recently. They expect the longest bull market in history to extend even further. We have a contrarian view instead to that. A nearby fade of the 2019 rally followed by a retest of the December 2018 lows is more likely than another chapter of the longest bull market in history.
To recap briefly, we forecasted a cyclical reversal for US equities on October 16th, 2018. That proved correct as US equities dropped by roughly 20% into the end of last year. Moreover, we expected a sharp rebound to develop after that drop. It also happened and took equities even higher than anticipated. We were surprised that US equities kept on extending to the upside. The reason for that is because the underlying analysis which led to the conclusions relies on probabilities. A lower odds pattern is most likely playing out instead of what we expected initially. It led into the recent all-time highs. Nevertheless, the conclusion regarding a cyclical correction remains valid. The US equity market is most likely correcting the bull run that started in 2009. The most recent highs are part of a B-wave within an expanded flat pattern. It will probably complete within the next few days and lead to the next leg down.
Plentiful macro data and early indicators show bearish readings. All important risky assets worldwide, except US equity indices, are well below their 2018 recovery highs. Their character fits rather within consolidation patterns. The aggregate situation is probably similar to what we witnessed in 2007. US equities reached into unconfirmed all-time highs back then. Most equity markets from overseas did not exceed their highs from 2000 in 2007. Moreover, US equities have neither confirmed their 2000 valuation excesses in 2007. 10-year cyclically adjusted P/E ratios (CAPE ratios) were in Autumn of 2007 below their 2000 all-time highs. Today, the US equity market probably unfolds a similar pattern as in 2000 and 2007 although on a smaller degree. The pattern is characterized by a slightly higher high than 2018 before the sharpest fractal of the correction kicks in.
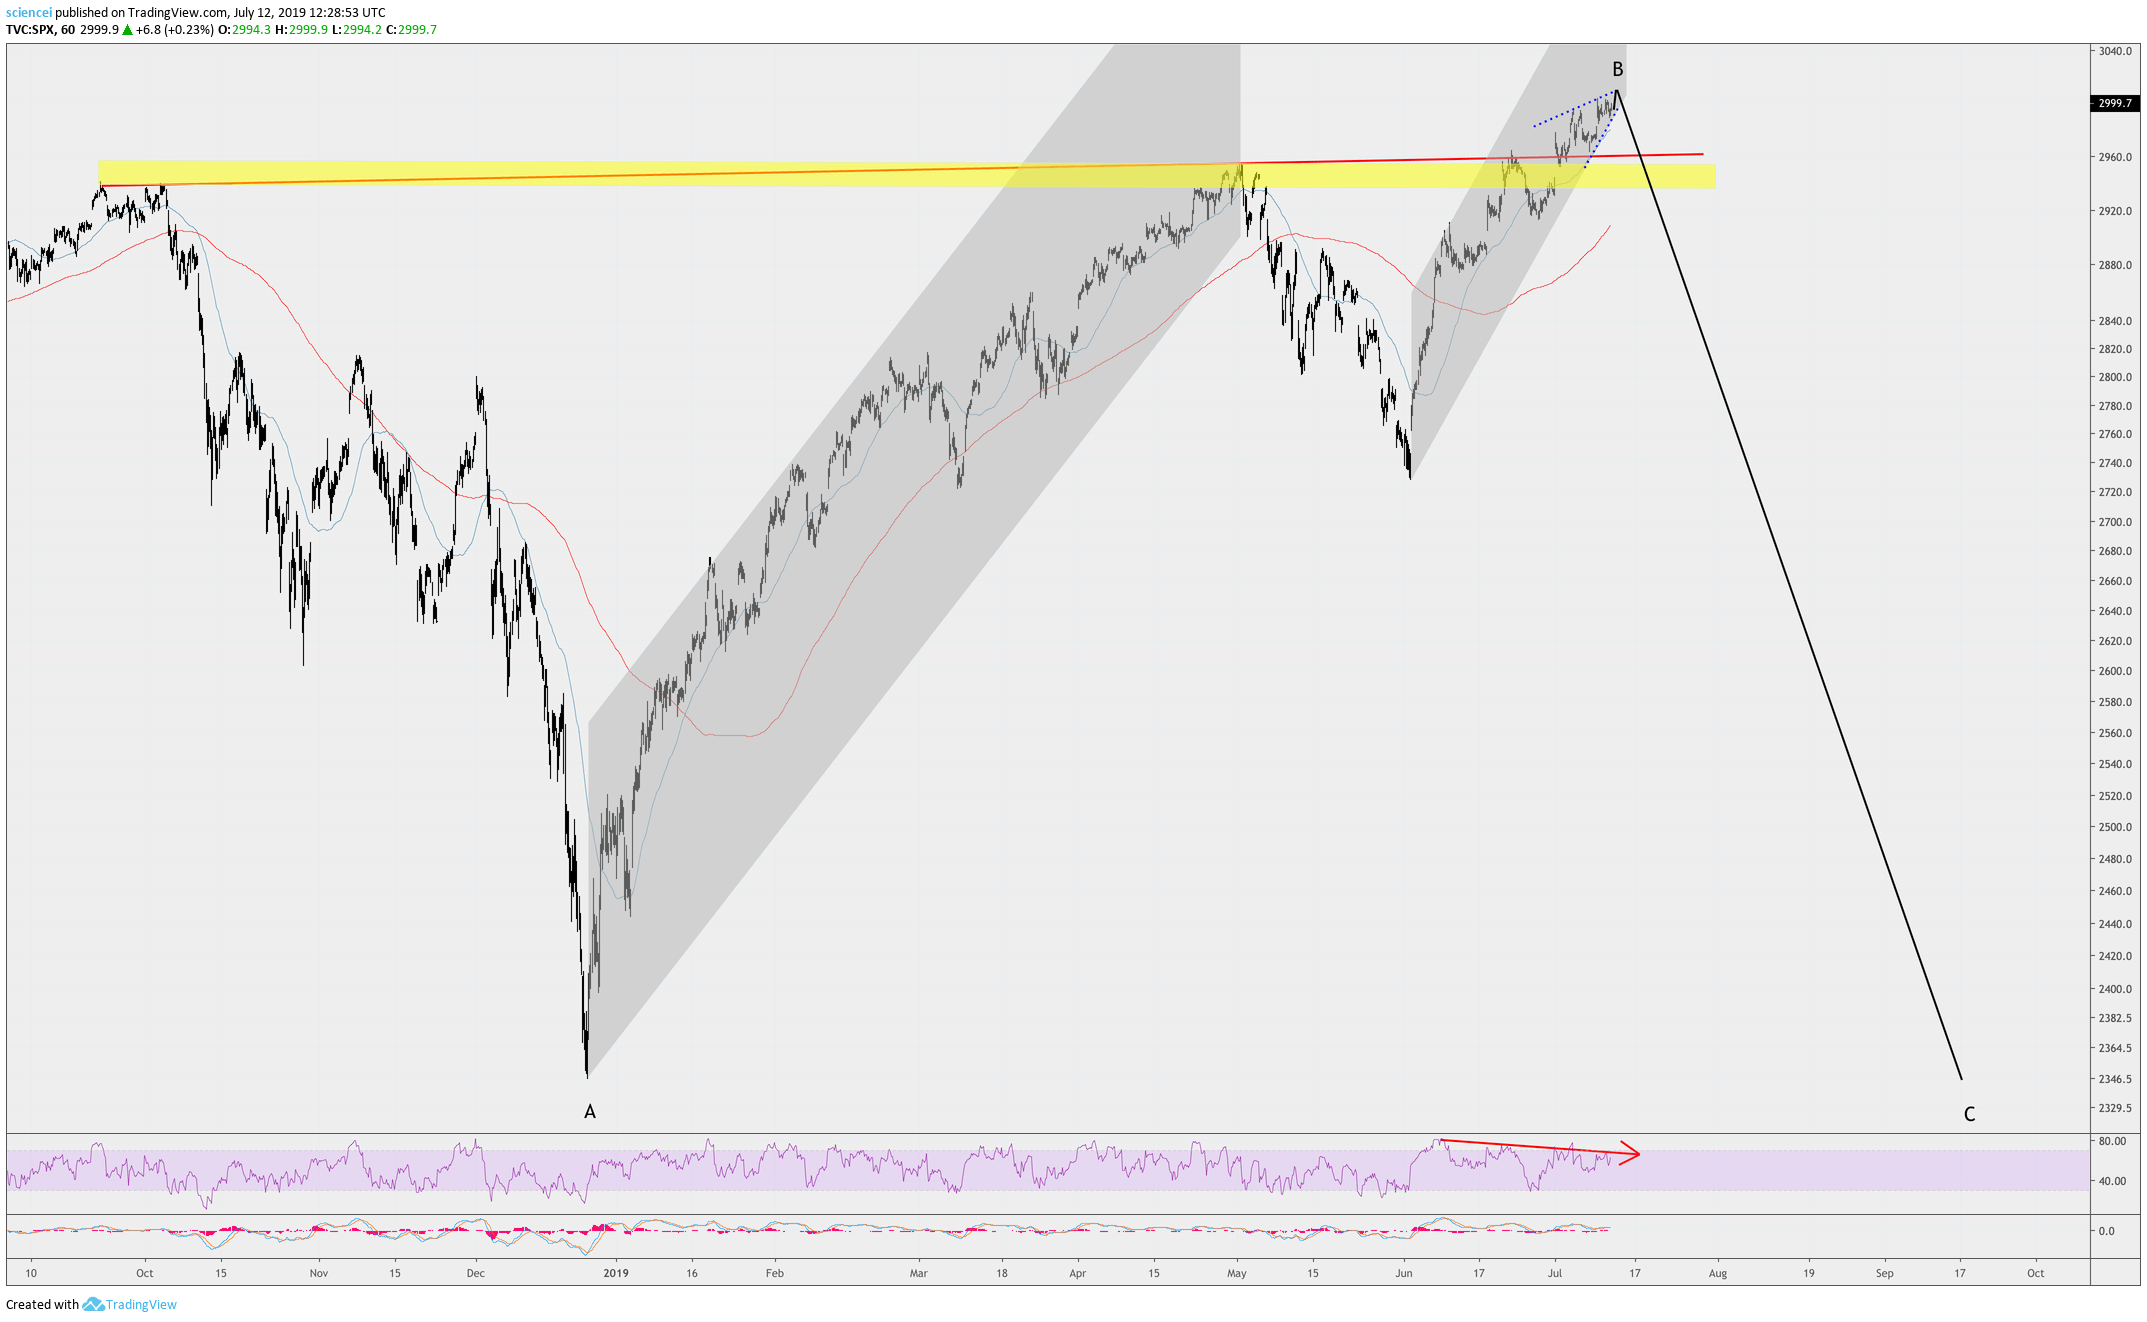
US equities extended along a zig-zag path to the upside. They are plausibly approaching terminal patterns. The S&P 500 is probably setting up a reversal pattern at the time of this write-up. It appears to trace an ending diagonal pattern recently. The pattern is highlighted by the blue dotted lines in chart below. Crossing 2,962 during the next few days to the downside confirms a diagonal from early June 2019. A reversal should find its way below the 2,933-2,953 cluster. That action will hint to a fake breakout. Technically oriented market participants will most likely supply the market below that area. The Nasdaq 100 and Dow Industrials appear incomplete at the time of this write-up. One or both indices are likely to display at least another upside swing before showing a complete pattern. It seems as if a small cross-market divergence is setting up for the major US indices these days. That’s precisely what we would like to see around a cyclical turn at this point.
Many market participants seem not to expect a market drop over the summer. Instead, they expect the market to grind up slowly during the summer. There is no evidence for a “summer put”. The years 1966, 1969, 1974, and 1998, for example, recorded sharp double-digit losses over the months of June-August. Sentiment gauges rebounded from bearish readings during December 2018 into neutral territory. Typically, sentiment readings have not reversed in a hit-and-run manner from bearish readings during cyclical turns. Instead, sentiment remained for an extended time period within negative territory while equities marked lower lows. We expect to see this again during the next few months.
The bottom line is that US equity indices are approaching a reversal. The subsequent correction will most likely target the December 2018 lows. Technical patterns, the sentiment picture, and historical observations lead to this conclusion. US equity indices are nearing a reversal.
Interested in more of our ideas? Check out Scienceinvesting for more details!
Interested in more of our ideas? Check out Scienceinvesting for more details!
Author

Science Investing Team
Science Investing


