Short term pain, long term gain in the ES?

Happy new year – Market liquidity is slowly coming back
As you know, our office takes the holiday season off from writing newsletters. This is partly because we need a break to clear our heads, but it is also because the price action that unfolds from Thanksgiving through the New Year is often inexplicable. Anyone who paid attention to the E-mini S&P 500 over the last few weeks will tell you very little made sense. Price swings were large, erratic, and primarily directionless in the end. This is a treacherous environment for speculation. Now that we are beyond the holiday season, liquidity and, hopefully, rationality will work their way into the financial markets. However, don't make the mistake of getting too aggressive too soon...there is still plenty of time for chaos as investors and funds rebalance, etc.
On a bright note, there is some hope for the 2023 prospects for equity markets. History tells us the market performs best when there is a Democratic President and Republican Congress... most likely because if the government can't get things done due to gridlock, they are less likely to screw something up. Further, Pre-Election years tend to be high performers; this is particularly true of the mid-term election year (2022 in this case) was a bear.
Treasury futures markets
30-year Treasury Bond Futures
Treasuries are likely a "buy the dip" market, but those dips can be BIG
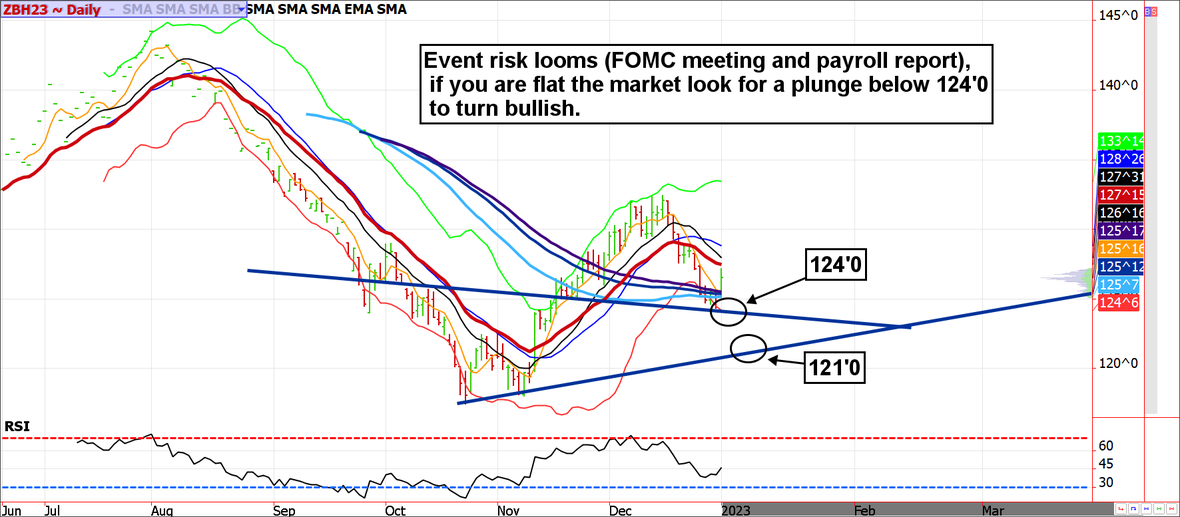
With the equity market struggling to hold its footing and signs of inflation slightly tapering, investors might like the idea of holding more Treasuries in their portfolio. Nevertheless, the only things that matter in the coming week or two are chart levels, the Fed, and the payroll report.
If you are flat the market, this is probably a good place to be for now. If you are lucky, one of the aforementioned events will trigger a long squeeze (sell stop running) below 124'0; we believe failure at 124'0 would allow prices to decline to 121'0. Yet, the bulls would face a high probability trading opportunity at such levels. Don't rush back into the markets; holiday market conditions linger into the New Year and could provide opportunities to those who are patient.
Treasury futures market consensus
There is a risk of a temporary fallout but buying large dips might be the way to go in Treasuries.
Technical Support: 124'0, 121'0, and 117'0 ZN: 111'26, 110'10, 108'31.
Technical Resistance: ZB: 128'30, 113'13, and 135'02 ZN: 113'18, 115'11, and 115'30.
Stock index futures
The first five days are often telling
According to the Stock Trader's Almanac, January's first five trading days are a viable early warning system indicating what might be in store for markets in the upcoming year. On the last 47 occasions in which there were S&P 500 gains in the first five trading days, a full year of gains was followed in 39 years for an 83% accuracy ratio. The average gain among those 47 winners was a whopping 14%.
Coming into 2023, the bulls are few and far between. Also, we know the markets have a bad habit of making significant lows in the month of March. This leaves the door open for at least one more swift selloff before the trend changes.
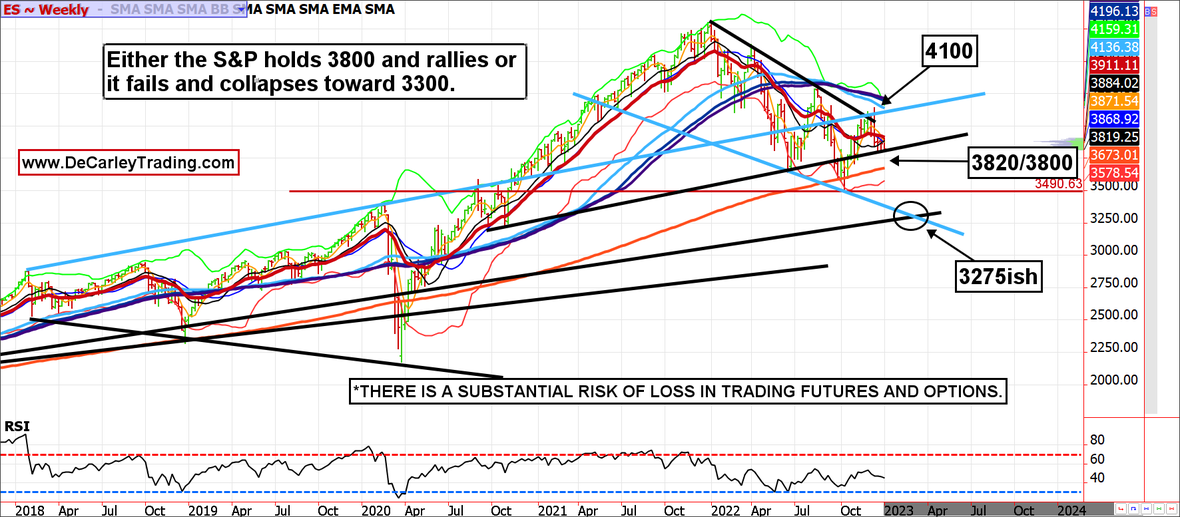
According to the daily chart, a break below 3800 is the last straw. If this occurs, we suspect the selling wouldn't dry up until prices print in the 3300/3275 area. Thus, traders should look at 3800 as a pivot (a place for bulls to gain exposure with tight stop loss risk but, for the bears, it is a place to consider chasing momentum).
Stock index futures market consensus
Failure for the market to hold 3800 could eventually lead to a plunge into the 3300 area (with several support levels along the way).
Technical Support: 3820/3800, 3760, 3670, 3550, 3400, 3250, 3000.
Technical Resistance: 4050, 4185, 4370, and 4440.
E-mini S&P futures swing/day trading levels
These are counter-trend entry ideas. The more distant the level, the more reliable, but the less likely it is to get filled.
ES Day Trade Sell Levels: 3920 (minor), 4050, 4130, 4185.
ES Day Trade Buy Levels: 3820, 3800, 3750, 3710, 3550, 3475.
In other commodity futures and options markets...
September 8 - Buy March 2023 Yen 7800 calls near 50 ticks.
September 16 - Buy March Cocoa 2350 call.
September 20 - Buy March sugar 18.00 call.
October 7 - January soybean 14/14.80 call spread.
October 7 - February crude oil 85/75 put spread with a naked 100 call to finance the trade.
October 10 - Buy the March wheat 9.00/8.00 put spread and sell the 12.00 call.
October 11 - Buy January coffee 220/240 call spread and sell the 190 put.
October 26 - Buy the January wheat 8.75/9.25 call spread for about 15 cents.
October 28 - Buy May soybean meal 410 call.
November 4 - Buy February $85/$80 crude oil put spread and sell the $103 call for a credit of about $1,000.
November 11 - Buy January sugar 19.50 put for about 40 ticks.
November 16 - Buy May coffee 170/200 call spread and sell a naked 140 put to finance the trade.
November 21 - Buy March cocoa 2600 call near 70 points ($700).
December 2 - Buy May wheat $8.00 call, sell the $9.00 call and sell the $7.00 put for a net cost of about 5 cents ($250).
December 23 - Buy March sugar 20.75 put for about 70 points ($784).
December 23 - Sell April nat gas $3.50 put.
Author

Carley Garner
DeCarley Trading
Carley Garner is an experienced commodity broker with DeCarley Trading, a division of Zaner, in Las Vegas, Nevada. She is also the author of multiple books including, “Higher Probability Commodity Trading” and “A Trader's First Book on Commodities”.


