Today, I’ll get y’all up to speed on the key labor market indicators for Japan, Australia, New Zealand, and Canada. Like last time, most of the links go straight to the official reports, so if you have insomnia, go ahead and read ’em and I guarantee you’ll be asleep in no time. And again, if you have any questions, go ahead and shoot me one on the comments section below.
Japan

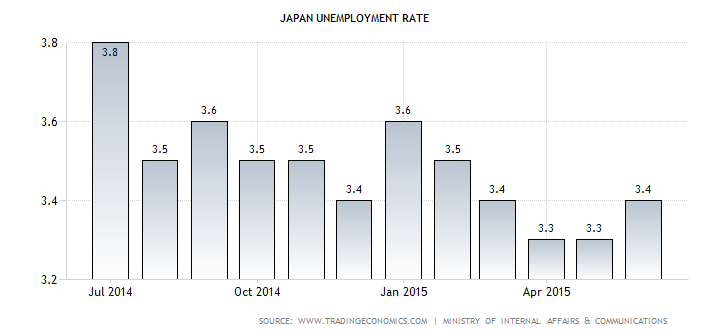
The Japanese economy saw an influx of new workers, which brought Japan’s total labor force from 66.24 million to 66.48 million. Interestingly enough, Japan’s labor force participation rate ticked higher from from 59.8% to 60.0%, which means that a larger percentage of the Japanese working-age population are now active in the labor market and also helps to explain the sudden influx of new workers.
Unfortunately, the Japanese economy wasn’t able to absorb all of the workers since the seasonally-adjusted jobless rate for June 2015 ticked higher from 3.3% to 3.4%, but it’s still an improvement when one considers June 2014’s 3.7% jobless rate. In the same vein, the number of unemployed people in June 2015 was 2.24 million, which is 210,000 less (8.6%) when compared to the previous year.
Looking at the details of the report, the manufacturing and the wholesale & retail trade sectors are still the top employers, with 10.20 million and 10.47 million employees respectively. The medical & health care sector is also a major employer, with 7.99 million workers.
As a side note, Japan’s economy has traditionally been dependent on its industrial sector and exports to fuel its economic growth, but 2013 data from the World Bank shows that private consumption now contributes 61.1% to Japan’s GDP. And if you add lower overseas demand for Japanese goods and the 8.0% consumption tax, then you can pretty much figure out that private consumption has been keeping the Japanese economy afloat, so perhaps forex traders will begin to give greater importance to the Japanese labor market.
Australia

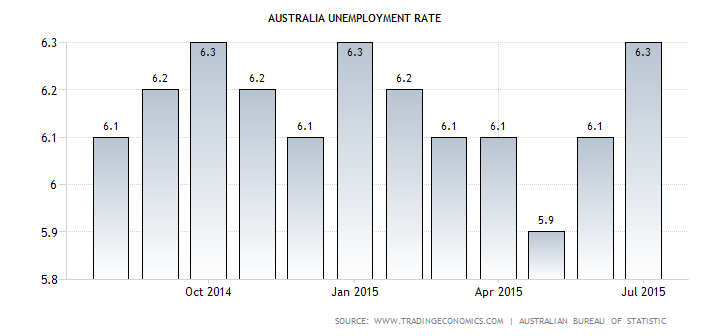
On the surface, Australia’s jobs report for July was a bit confusing to many forex traders since the jobless rate climbed higher to 6.3% from the previous reading, which was revised higher from 6.0% to 6.1%, but employment change saw a net increase of 38.5K jobs (10.2K expected, 7.0K previous).
Don’t worry, though, Forex Gump’s got your back! I dug around the Australian Bureau of Statistics’ “Labour Force” report and found that employment increased by 38,500 to 11,797,300, with 12,400 people getting full-time jobs and 26,100 people getting part-time jobs, but the number of unemployed people increased by 40,100 to 800,700.
Like Japan, it looks like more working-age people are joining/re-joining the active work force because the labor force participation rate climbed higher by 0.3% to 65.1%, and like Japan, the Australian economy wasn’t able to absorb the new workers, which is why the jobless rate climbed higher even though employment change saw a net increase in jobs.
So is this good or bad? Well, in the short-term it’s bad because the Australian economy failed to provide the new workers with jobs, but in the long-term and assuming that the Australian economy would be able to provide enough jobs, it could be good since the Reserve Bank of Australia kept complaining in its August Statement on Monetary Policy that lower rates of population growth are going to be a bane to Australia’s labor market, domestic consumption, and productive capacity in the future, so a higher labor force participation rate slightly alleviates that.
New Zealand

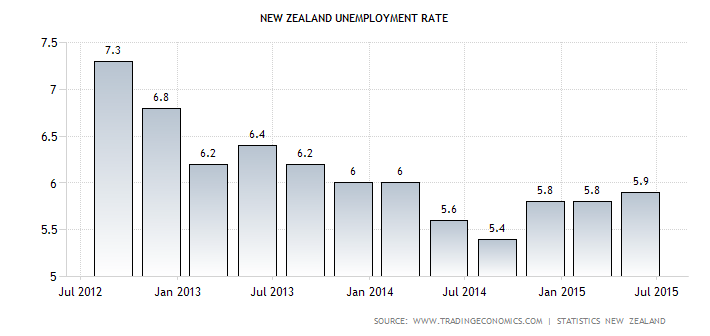
Middle Earth’s Q2 2015 jobless rate ticked higher to 5.9% from 5.8% previous but the employment rate and the labor force participation rate declined by 0.3% and 0.2% respectively. According to Diane Ramsay, Statistics New Zealand’s labour market and household statistics manager, higher population growth was the culprit for the wonky statistics. It does make sense if you think about it. Essentially, New Zealand’s economy wasn’t able to absorb an influx of new workers due brought about by higher population growth. I guess a good number of young Hobbits are having difficulty finding jobs?
On a more upbeat (and serious) note, average hourly earnings increased by 0.8% quarter-on-quarter and an impressive 2.8% year-on-year. And while employment change only grew by 0.3% (0.6% previous), it was still the 11th consecutive quarter of employment growth, which is a good thing.
Canada

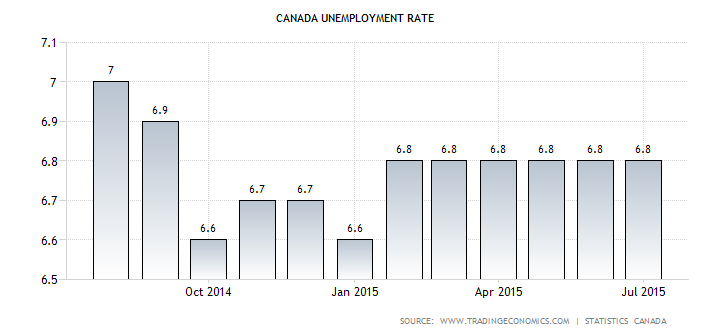
According to Statistics Canada, the Canadian economy saw a net gain of 6.6K jobs for the month of July, which is a nice turn of events after losing 6.4K jobs last month. The jobless rate, meanwhile, continued to hold steady at 6.8% for the sixth consecutive month now.
Looking at the details of the report, the number of self-employed increased by 1.5% to 2.7 million Canadians, which managed to offset the 0.2% decrease in employed personnel. The health care services sector was also largest employer, employing around 2.3 million people. This is followed by the manufacturing sector, which employs 1.7 million people. Meanwhile, the natural resources industry, which includes forestry, fishing, mining, quarrying, and oil and gas extraction continued to see layoffs, decreasing by 0.6% month-on-month and 2.6% year-on-year.
Recommended Content
Editors’ Picks
EUR/USD edges lower toward 1.0700 post-US PCE

EUR/USD stays under modest bearish pressure but manages to hold above 1.0700 in the American session on Friday. The US Dollar (USD) gathers strength against its rivals after the stronger-than-forecast PCE inflation data, not allowing the pair to gain traction.
GBP/USD retreats to 1.2500 on renewed USD strength

GBP/USD lost its traction and turned negative on the day near 1.2500. Following the stronger-than-expected PCE inflation readings from the US, the USD stays resilient and makes it difficult for the pair to gather recovery momentum.
Gold struggles to hold above $2,350 following US inflation

Gold turned south and declined toward $2,340, erasing a large portion of its daily gains, as the USD benefited from PCE inflation data. The benchmark 10-year US yield, however, stays in negative territory and helps XAU/USD limit its losses.
Bitcoin Weekly Forecast: BTC’s next breakout could propel it to $80,000 Premium

Bitcoin’s recent price consolidation could be nearing its end as technical indicators and on-chain metrics suggest a potential upward breakout. However, this move would not be straightforward and could punish impatient investors.
Week ahead – Hawkish risk as Fed and NFP on tap, Eurozone data eyed too

Fed meets on Wednesday as US inflation stays elevated. Will Friday’s jobs report bring relief or more angst for the markets? Eurozone flash GDP and CPI numbers in focus for the Euro.