Pandemics and Gold: How other pandemics in recent decades affected Gold?

In the first part, we analyzed the HIV/AIDS pandemic, as the most deadly pandemic since the 1971, and the SARS pandemic, as the most similar to the current COVID-19 pandemic. However, we have witnessed several other pandemics in the recent decades. Let’s investigate them now and draw conclusions for the global economy and the gold market.
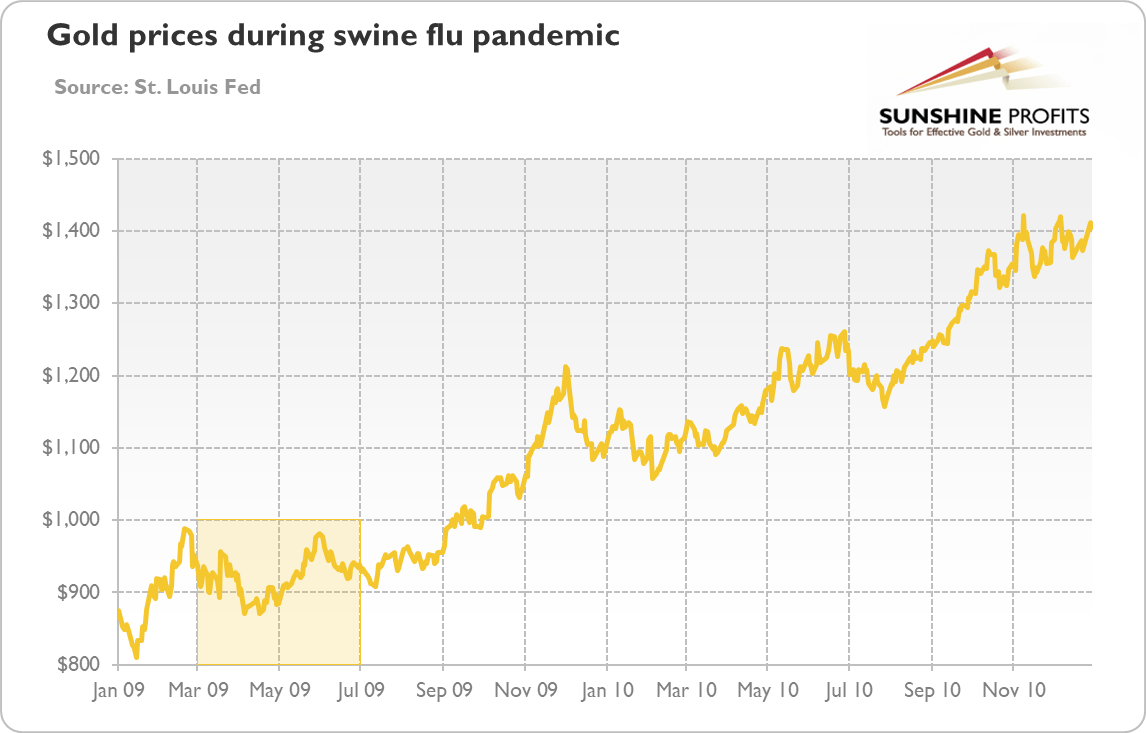
Let’s start with the epidemic of 2009 A/H1N1 flu, called also the swine flu. It originated in pigs from central Mexico and lasted from early 2009 to late 2010. It was highly contagious, as around 1.66 billion of people, or 24 percent of the then global population, contracted the illness. Luckily, the case-fatality rate was very small, around 0.001-0.0035 percent, which resulted in an estimated range of deaths from between 151,700 and 575,400 people, around 10 times higher than the first estimates based on the number of cases confirmed by lab tests. The peak of interest in the swine flu occurred in April 2009, while the number of cases peaked in June 2009. As one can see in the chart below, the price of gold did not rally to the hysteria about the swine flu. It is true that gold started in mid-2009 its great bull market, but the rally came after the peak in the swine flu outbreak, so it seems that it was rather a reaction to the Great Recession and the Fed’s quantitative easing.
Chart 1: Gold prices during swine flu pandemic (London P.M. Fix, in $).
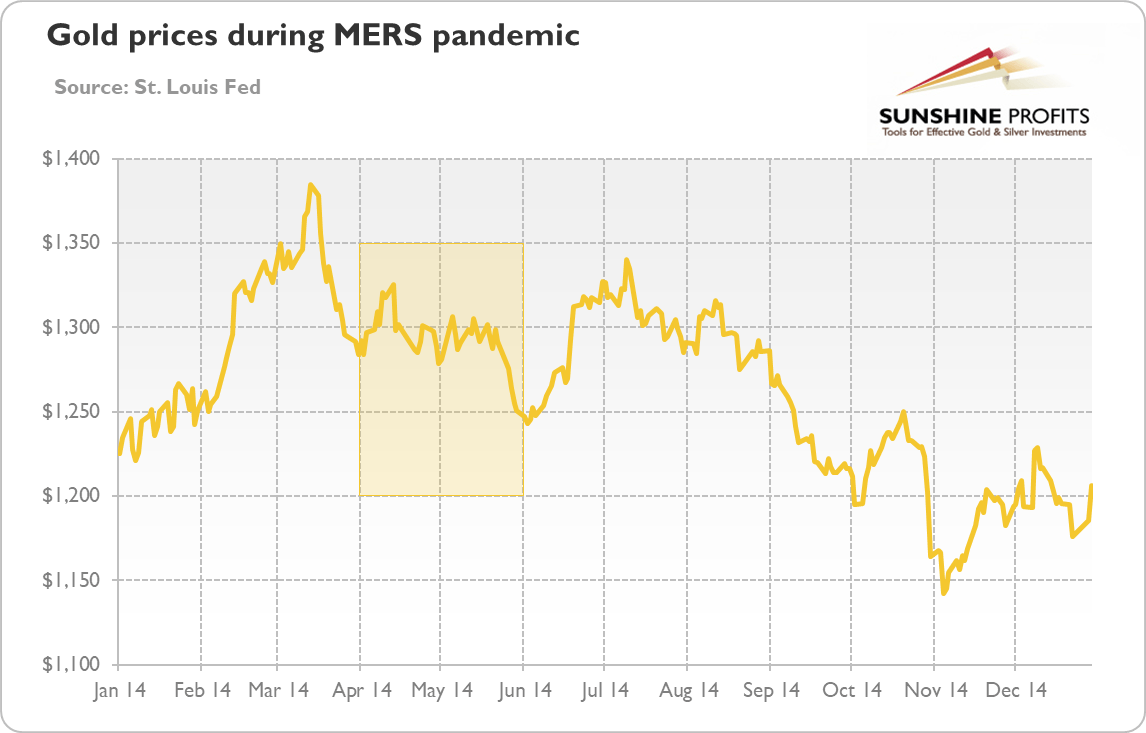
The next pandemic originated in 2012 in the Middle East, so it was named Middle East Respiratory Syndrome (MERS). Just like the COVID-19 and SARS, the MERS was caused by the virus from the coronavirus group. It was likely transmitted to humans through camels and was much more dangerous than the swine flu, as its fatality rate was 34 percent. However, only 2,506 cases and 862 deaths were reported from 2012 to January 15, 2020. The peak of infection and the peak of interest occurred in April – May 2014. As the chart below shows, gold prices actually declined during the peak of MERS pandemic, which was probably caused by the limited geographical scope – the majority of cases were reported from Saudi Arabia and other countries in the Eastern Mediterranean.
Chart 2: Gold prices during MERS pandemic (London P.M. Fix, in $).
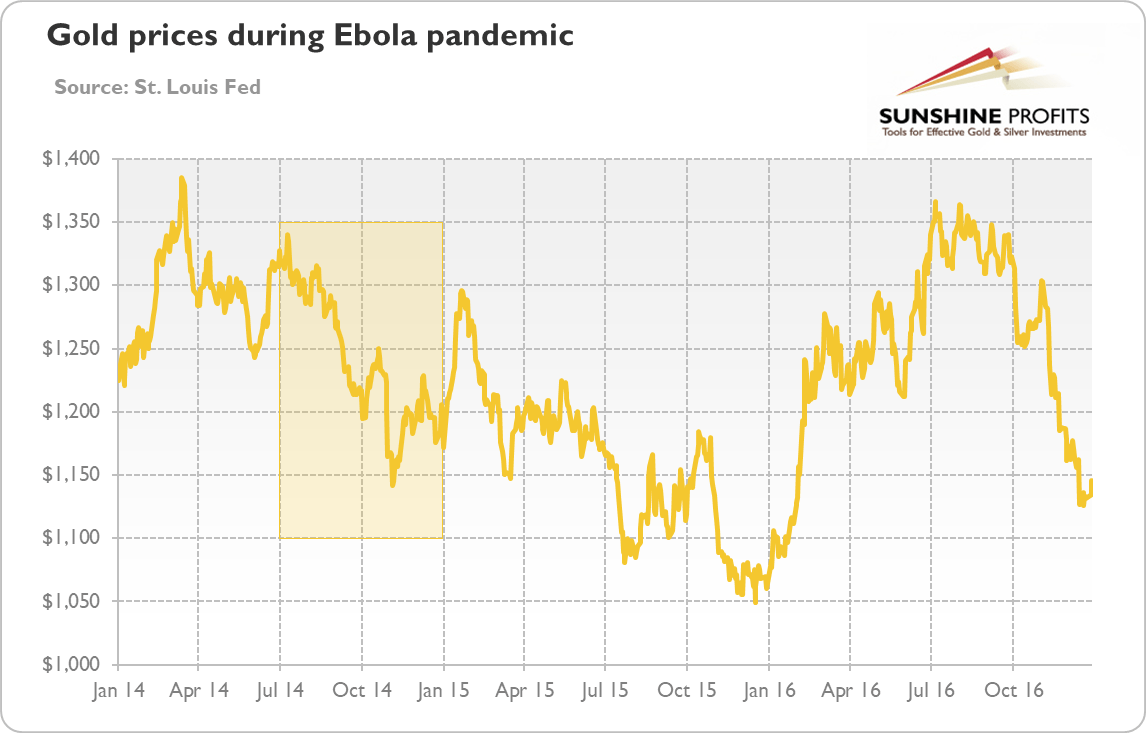
Another recent pandemic was the West African Ebola virus. It originated in December 2013 in Guinea and lasted until 2016. According to the official data, there were a total of 28,646 suspected, probable and confirmed cases and 11,323 deaths (case-fatality rate of 39.5 percent), but the WHO suspects that the true number may be higher. The interest in Ebola virus started to rally in summer 2014 and remained elevated through the whole year, with the culmination in October. But as the chart below shows, gold prices decreased in that period. The probable reason of the gold’s bearish reaction is the fact that the pandemic was contained to, as the name suggests, West Africa (mainly in Guinea, Liberia, and Sierra Leone), which is neither the major financial center nor the industrial center, like China is.
Chart 3: Gold prices during Ebola pandemic (London P.M. Fix, in $).
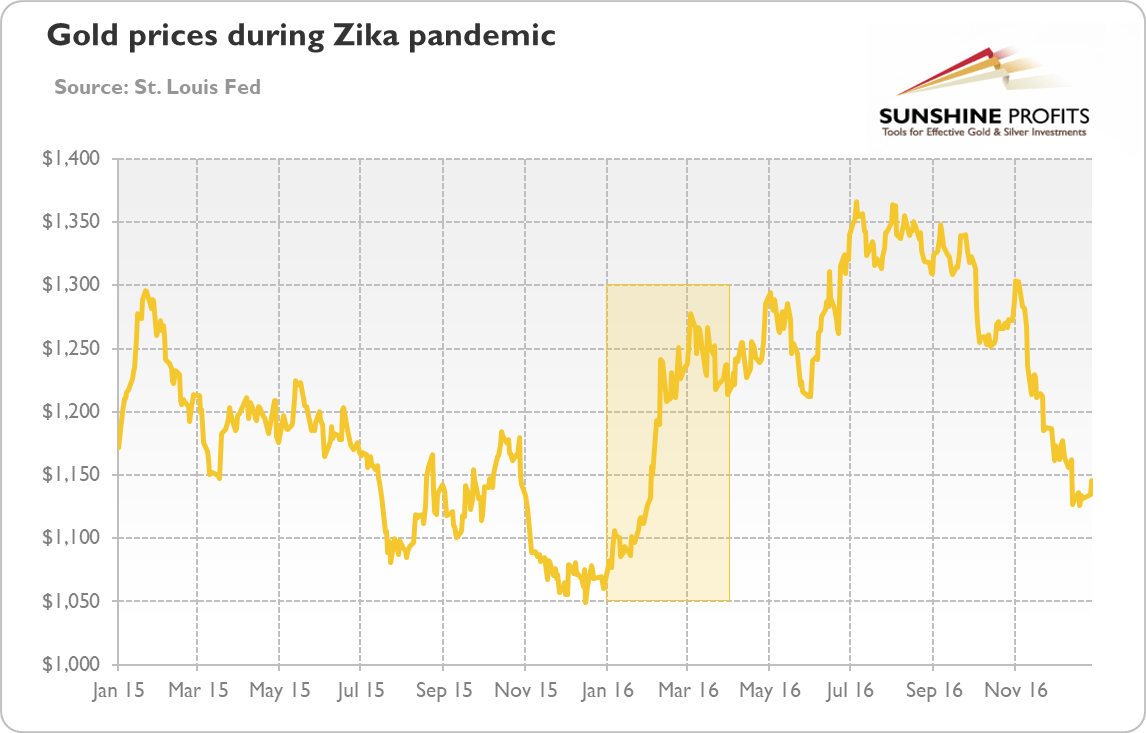
The next pandemic was the Zika fever caused by Zika virus in Brazil that started in March 2015. In November 2016, the WHO announced that Zika is no longer a public health emergency of international concern. It was estimated that 1.5 million people were infected by Zika in Brazil, with over 3,500 cases of microcephaly reported between October 2015 and January 2016. The interest in Zika virus started to rally in January 2016 and remained elevated through the whole year, with peaks in February and then again albeit lower in August.
The price of gold also started to rally in January 2016, as the chart below shows. However, it’s rather a coincidence as the more detailed analysis does not show the positive correlation between the gold prices and the interest in the Zika virus. For example, the latter plunged in March, but gold prices did not – there was a correction, but not a plunge. And despite the downward trend in the number of cases and the interest in the Zika virus, the price of gold generally was going upwards until September hawkish FOMC meeting. Gold’s performance was driven more by the macroeconomic evens such as the introduction of the NIRP by the Bank of Japan in January 2016.
Chart 4: Gold prices during Zika pandemic (London P.M. Fix, in $).
Summing up, gold does not always react positively to pandemics. In some cases (MERS and Ebola), the price of the yellow metal even declined! It confirms our view that in the long-run, geopolitical drivers and all sorts of natural disasters are less important to the gold market than macroeconomic or fundamental factors. Gold is especially unmoved when the epidemic is geographically contained and it does not affect significantly the developed countries and the world’s economy. As we often repeat, geopolitical events move the gold market the most significantly when they affect directly the US or the global economy.
Thus, our historical analysis implies that the current outbreak of COVID-19does not have to provide a sustained rally in the gold prices. Of course, this time may be different. This is because the new coronavirus originated in China, which is now an important part of the global economy and a major industrial center strongly linked through the supply chains with the US and European companies. But investors should not give in to fear – although in previous pandemics the stock market always plunged initially, it quickly gave way to a recovery and significant gains. It implies that the recent shift towards the safe-havens assets such as gold may reverse later in the future… unless the Fed chickens out and eases its monetary policy, which – given the recent spread of the coronavirus to the Europe and the US – has become more likely.
Want free follow-ups to the above article and details not available to 99%+ investors? Sign up to our free newsletter today!
Want free follow-ups to the above article and details not available to 99%+ investors? Sign up to our free newsletter today!
Author

Arkadiusz Sieroń
Sunshine Profits
Arkadiusz Sieroń received his Ph.D. in economics in 2016 (his doctoral thesis was about Cantillon effects), and has been an assistant professor at the Institute of Economic Sciences at the University of Wrocław since 2017.


