Oil Reaches Decision Zone at $59 & 50% Fibonacci

Oil is in a bullish channel but a strong 50% Fibonacci level could stop the trend from moving higher. The resistance level is a key decision zone for a bearish bounce or bullish breakout.
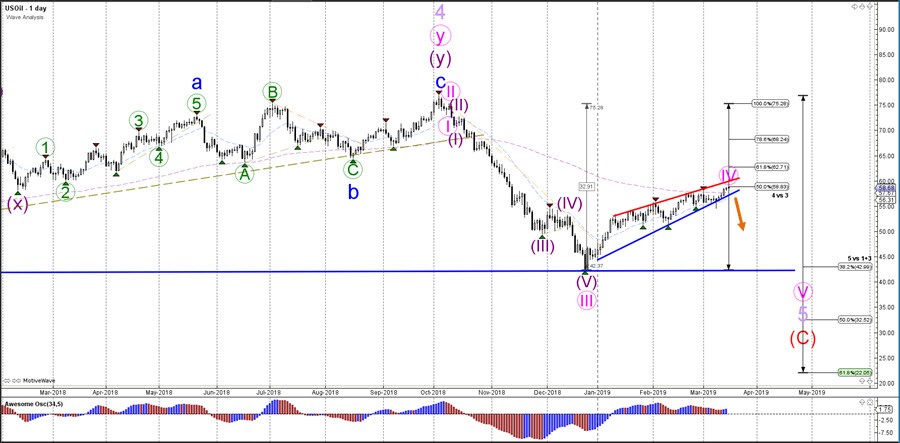
US OIL
Daily
A bearish bounce could confirm the current wave pattern outlook, which is a wve 4 (pink) retracement within the downtrend. A bearish breakout below the support (blue) of the channel could send oil back lower (orange arrow). A bullish break above the 50% Fib however could indicate that a different wave pattern is more likely.
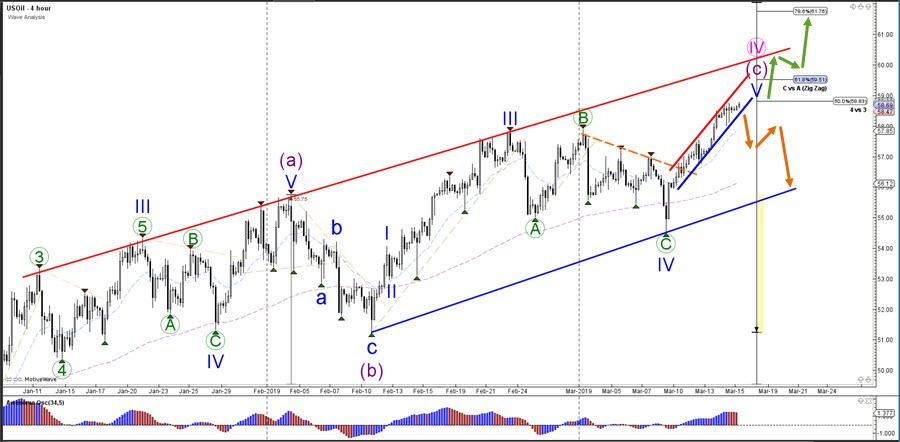
4 hour
Oil is showing bullish momentum, but if the current wave outlook is correct, then this could be the final push higher as part of a wave 5 (blue) of wave C (purple) of wave 4 (pink). A break below the channel could indicate a change of price direction and take price back to the bottom of the larger channel.
The analysis has been done with the CAMMACD.MTF template.
For more daily technical and wave analysis and updates, sign-up up to our ecs.LIVE channel.
Author

Chris Svorcik
Elite CurrenSea
Experience Chris Svorcik has co-founded Elite CurrenSea in 2014 together with Nenad Kerkez, aka Tarantula FX. Chris is a technical analyst, wave analyst, trader, writer, educator, webinar speaker, and seminar speaker of the financial markets.


