Oil Futures “should” hold $80 for now – Strategy Idea: Bull call spread w/a naked leg in crude oil

Strategy idea...Bull call spread w/ a naked leg in crude oil
Oil Futures "should" hold $80 for now
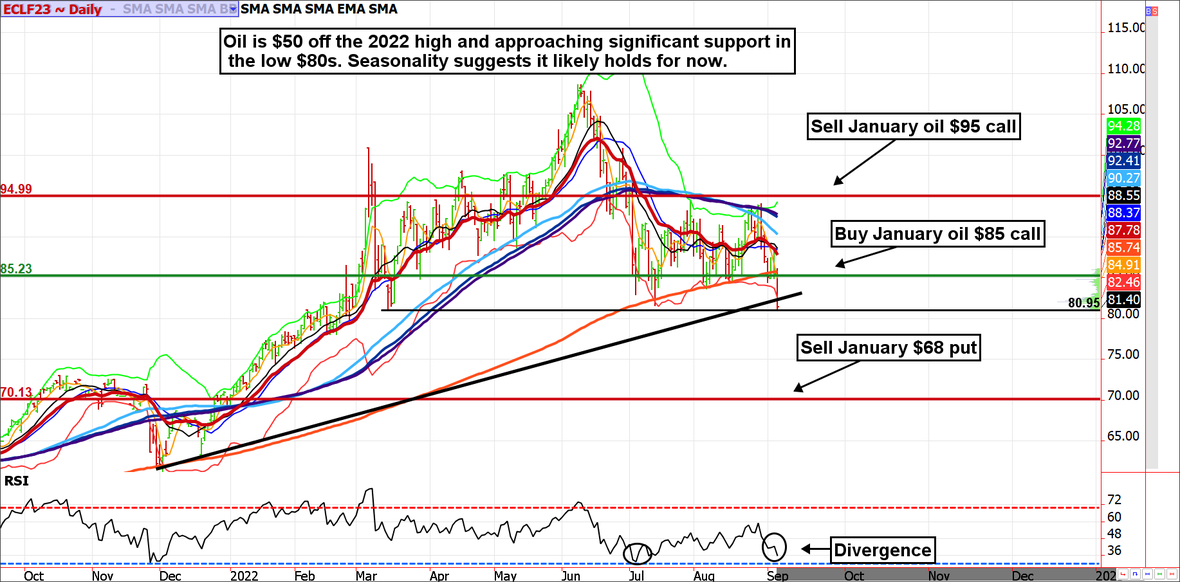
While the bigger picture isn't necessarily bullish for oil, in our opinion, we suspect the recent sell off has wiped out a bulk of the long speculators and prices are near significant technical support (trendline and March low) as well as the psychological level of $80.00 per barrel. Further, seasonality is generally supportive through mid-October. This "should" give the market an opportunity for a rally in the coming weeks.
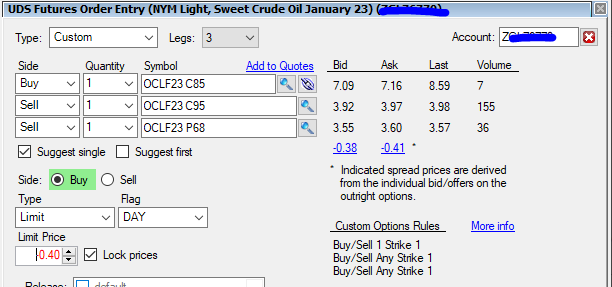
Aggressive traders could consider buying a January vertical call spread and then selling a put to pay for it. We like the $85/$95 vertical spread and selling the $68 put for a small credit of about $350.
This strategy can get stressful if oil falls under $80.00 and might require a hedge should that occur (sell micro futures against it). But at expiration, the risk doesn't come in until $68.00 (the risk is unlimited below this price at expiration).
Alternative strategies
Risk averse traders can consider using December micro options to buy an $85 call outright for about $600 or the December $85/$95 vertical spread for about $300 (the January micro oil options aren't liquid yet). Another "option" isn't an option at all, traders could consider going long a micro oil futures contract from the low $80.00s.
*Micro futures and options are 1/10th the size of the original contract or worth $100 per $1 in price of oil.
BUY January oil bull call spread with a naked leg
BUY JANUARY CRUDE OIL $85 CALL.
SELL JANUARY CRUDE OIL $95 CALL.
SELL JANUARY CRUDE OIL $68 PUT.
Total Credit = 35 cents or $350 minus transaction costs.
These options expire on December 15 - 99 days to expiration.
Margin = $6,600.
Risk = Unlimited below $68.00.
Maximum Profit = About $10,300 if held to expiration, which isn't likely. A worthy goal would be $2,500 to $4,000.
Zaner360 symbols
OCLF23 C85, OCLF23 C95, OCLF23 P68.
*There is a substantial risk of loss in trading futures and options. There are no guarantees in speculation; most people lose money trading commodities. Past performance is not indicative of future results.
Due to time constraints and our fiduciary duty to put clients first, the charts provided in this newsletter may not reflect the current session data.
Seasonality is already factored into current prices, any references to such does not indicate future market action.
These recommendations are a solicitation for entering into derivatives transactions. All known news and events have already been factored into the price of the underlying derivatives discussed. From time-to-time persons affiliated with Zaner, or its associated companies, may have positions in recommended and other derivatives. Past performance is not indicative of future results. The information and data in this report were obtained from sources considered reliable. Their accuracy or completeness is not guaranteed. Any decision to purchase or sell as a result of the opinions expressed in this report will be the full responsibility of the person authorizing such transaction. Seasonal tendencies are a composite of some of the more consistent commodity futures seasonals that have occurred over the past 15 or more years. There are usually underlying, fundamental circumstances that occur annually that tend to cause the futures markets to react in similar directional manner during a certain calendar year. While seasonal trends may potentially impact supply and demand in certain commodities, seasonal aspects of supply and demand have been factored into futures & options market pricing. Even if a seasonal tendency occurs in the future, it may not result in a profitable transaction as fees and the timing of the entry and liquidation may impact on the results. No representation is being made that any account has in the past, or will in the future, achieve profits using these recommendations. No representation is being made that price patterns will recur in the future.
Author

Carley Garner
DeCarley Trading
Carley Garner is an experienced commodity broker with DeCarley Trading, a division of Zaner, in Las Vegas, Nevada. She is also the author of multiple books including, “Higher Probability Commodity Trading” and “A Trader's First Book on Commodities”.


