|

NZD/USD turning lower from Elliott Wave blue box area

In this technical blog, we are going to take a look at the past performance of NZDUSD, 4-Hour Elliott wave Charts that we presented to our members. But before looking into the Charts, we need to understand the market nature first. The market always fights between the two sides i.e Buying or Selling. We at Elliott Wave Forecast understand the Market Nature and always recommend trading the no-enemy areas. We called blue boxes on our charts as no-enemy areas. They usually give us the reaction in favor of market direction in 3 swings at least. Now, let us take a quick look at the NZDUSD Charts and structure below:

NZD/USD 4 Hour Elliott Wave Chart

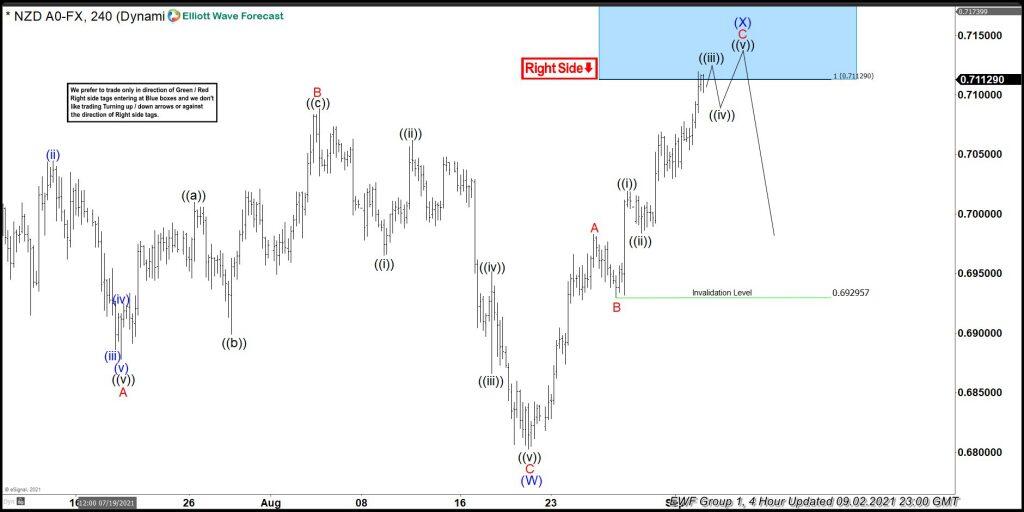
Above is the 4hr Elliott wave chart update from 9/02/2021. In which, the decline from February 2021 peak ended wave (W) at $0.6802 low. Up from there, the pair corrected the cycle from the February peak in wave (X) bounce. The internals of that bounce unfolded as Elliott wave zigzag structure where wave A ended at $0.6983 high. Wave B ended at $0.6929 & Wave C was expected to find sellers at $0.7112- $0.7225 blue box area. From there, sellers were expected to appear looking for more downside or for a 3 wave reaction lower at least.

NZD/USD Latest 4 Hour Elliott Wave Chart

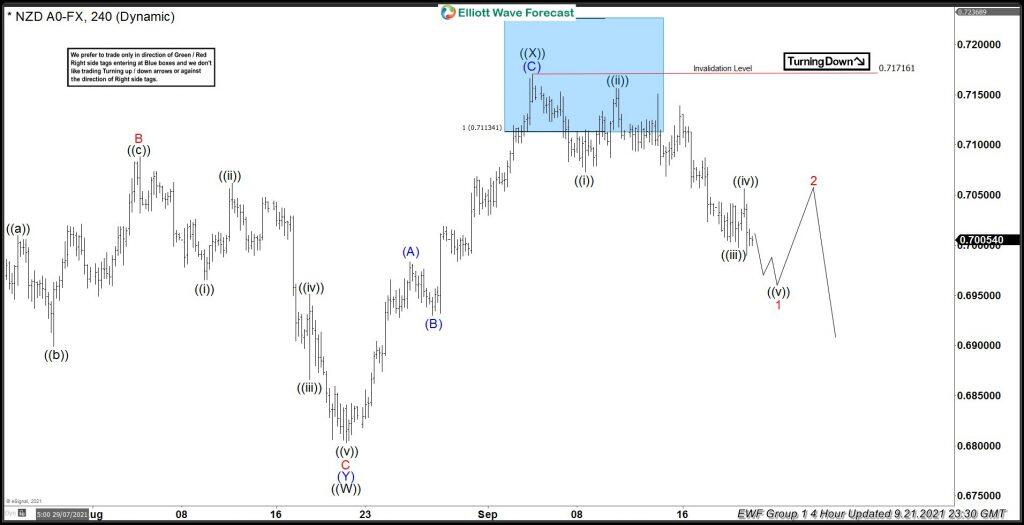
This is the latest 4hr Elliott wave Chart from the 9/21/2021 update. In which the pair is showing a strong reaction lower taking place from the blue box area at $0.7112- $0.7225. Right after ending the zigzag correction within the blue box area. Allowed members to create a risk-free position shortly after taking the short positions at the blue box area. However, a break below $0.6802 low remains to be seen to confirm the next extension lower & avoid double correction higher. Note: later on with more data, we were able to upgrade the primary degree of the structure.

Author

Elliott Wave Forecast Team

Elliott Wave Forecast Team

ElliottWave-Forecast.com

More from Elliott Wave Forecast Team
Share:

Editor's Picks

EUR/USD looks offered below 1.1900

EUR/USD keeps its bearish tone unchanged ahead of the opening bell in Asia, returning to the sub-1.1900 region following a firmer tone in the US Dollar. Indeed, the pair reverses two consecutive daily gains amid steady caution ahead of Wednesday’s key US Nonfarm Payrolls release.
 

GBP/USD slips back to daily lows near 1.3640

GBP/USD drops to daily lows near 1.3640 as sellers push harder and the Greenback extends its rebound in the latter part of Tuesday’s session. Looking ahead, the combination of key US releases, including NFP and CPI, alongside important UK data, should keep the pound firmly in focus over the coming days.

Gold the battle of wills continues with bulls not ready to give up

Gold remains on the defensive and approaches the key $5,000 region per troy ounce on Tuesday, giving back part of its recent two day. The precious metal’s pullback unfolds against a firmer tone in the US Dollar, declining US Treasury yields and steady caution ahead of upcoming key US data releases.

Bitcoin's downtrend caused by ETF redemptions and AI rotation: Wintermute

Bitcoin's (BTC) fall from grace since the October 10 leverage flush has been spearheaded by sustained ETF outflows and a rotation into the AI narrative, according to Wintermute.

Dollar drops and stocks rally: The week of reckoning for US economic data

Following a sizeable move lower in US technology Stocks last week, we have witnessed a meaningful recovery unfold. The USD Index is in a concerning position; the monthly price continues to hold the south channel support.

XRP holds $1.40 amid ETF inflows and stable derivatives market

Ripple trades under pressure, with immediate support at $1.40 holding at the time of writing on Tuesday. A recovery attempt from last week’s sell-off to $1.12 stalled at $1.54 on Friday, leading to limited price action between the current support and the resistance.