- Market Movers: Weekly Technical Outlook
- Fed Chair Yellen may Backpedal from 6-Month Notion
- Look Ahead: Stocks
- Look Ahead: Commodities
- Data Highlights
Market Movers: Weekly Technical Outlook
Technical Developments to Watch:
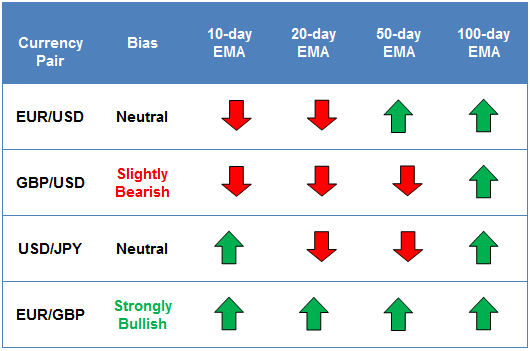
- EUR/USD bearish below 20-day EMA, next Fib support at 1.3660
- GBP/USD back above 1.6600, but key resistance still looms above 1.6700
- USD/JPY lackluster in the middle of 101.00-103.50 range
- USD/CAD in play, key supports at 1.1025 & 1.0955

* Bias determined by the relationship between price and various EMAs. The following hierarchy determines bias (numbers represent how many EMAs the price closed the week above): 0 – Strongly Bearish, 1 – Slightly Bearish, 2 – Neutral, 3 – Slightly Bullish, 4 – Strongly Bullish.
** All data in this section as of approximately 4:00pm GMT Friday **
EUR/USD
- EUR/USD broke 38.2% Fib support (not shown), continued lower last week
- MACD bearish, though Slow Stochastics near oversold territory
- Bias remains bearish below 20-day EMA
After brief bounce early in the week, the EUR/USD continued to fall last week, breaking below initial 38.2% Fibonacci retracement support in the process. Concurrently, the MACD has crossed below its signal line, indicating a shift to bearish momentum, though the Slow Stochastics are near oversold territory, so a brief bounce is possible early this week. In general, we maintain a bearish bias on the pair below the 20-day EMA, and will continue to watch for a possible continuation down toward 1.3660 next.

GBP/USD
- GBP/USD recovered strongly off 61.8% Fib support last week
- MACD may be turning back higher
- Bias generally neutral, though strong resistance still looms above 1.6700
The GBP/USD rallied sharply last week, helped along by a much stronger-than-expected Retail Sales report on Thursday. Though we anticipated a bounce, we did not expect it to take the pair all the way back above the 1.6600 handle, and as a result, the technical picture is more muddled than it was previously. The MACD is looking like it may cross back above its signal line, which would indicate a shift back to bullish momentum later this week. Nonetheless, strong resistance looms up above the 1.6700 handle, so more conservative traders may want to consider sell opportunities if rates reach this area, especially if confirmed by a bearish candlestick pattern.

USD/JPY
- USD/JPY trade lackluster last week
- MACD and Slow Stochastics show balanced, two-way trade
- Overall bias still neutral as rates consolidate within 101.00-103.50 range
The USD/JPY is coming off a relatively quiet week, where rates primarily consolidated within the middle of the recent 101.00-103.50 range. In fact, as of writing around Friday’s European close, the pair is on track for one of its smallest weekly ranges since December 2012! As you might expect in a range-bound market, both the MACD and Slow Stochastics are indicating balanced, two-way trade, and the 20-day MA has essentially flatlined. For this week, a neutral bias is appropriate, and traders may look to fade, or bet against, any move toward the edge of this range. For more on the pair and how it’s been impacted by the recent Fed comments, see Wednesday’s article, “USD/JPY Nonplussed by Fedspeak”.

USD/CAD
- USD/CAD dropped sharply last week
- MACD turning back lower, indicating bearish momentum
- Bounce possible off rising trend line support or 1.0955 support early this week
The USD/CAD is our currency pair in play this week, due to a number of major data releases culminating in Friday’s dual employment reports (see the “Global Data Highlights” section below for more). Last week, the pair saw a false breakout above longer-term Fibonacci retracement resistance at 1.1230 before dropping sharply all the way down to test the 1.1000 area. With last week’s big drop, the pair has now fallen below its 20-day MA, a common measure of the near-term trend. Meanwhile, the MACD has started to cross back below its signal line, suggesting a shift back toward bearish momentum. For this week, traders will watch for support to emerge around the bullish trend line near 1.1030 or the 1.0955 level; if those floors break, the odds of a deeper retracement increase dramatically.

Fed Chair Yellen may Backpedal from 6-Month Notion
At the meeting in March, the Fed decided to scale back their asset purchases by another $10B to $55B in April. This decision was well televised by the FOMC, as hawks and doves alike have affirmed the view that scaling back QE is here to stay and that the likely measured reductions to the pace of monthly asset purchases (by $10B) will be unwavering over the coming meetings. As a result, if the current pace of Fed tapering remains on track, then asset purchases are set to come to an end by the beginning of Q4 2014.

The timing of the Fed’s decision to end QE has become more pertinent because at their meeting in March, the FOMC removed their quantitative guidance to keep rates “exceptionally low…as long as the unemployment rate remains above 6.5%” and altered it to that of a more qualitative approach. One of the key proclamations in their statement was that they believe it is appropriate to maintain the current fed funds rate for a “considerable time after the asset purchase program ends”. While this in itself would sound rather ambiguous, in Janet Yellen’s inaugural press conference as Fed Chairman she stated that a “considerable period” of time could be “something on the order of around 6 months”. This was a surprise because historical FOMC precedent suggested the general period of time between their last ease and first hike was typically 12 months or more. As a result, this suggested that rates could begin moving higher as soon as Q2 2015.
That being said, when we deciphered Fed Chairman Yellen’s press conference in its entirety, we found that she softened the ‘6 month’ reference regarding the time needed to hike rates by highlighting their inflation mandate “if we have a substantial shortfall in inflation [and] inflation is persistently running below our 2% objective; that is a very good reason to hold the funds rate at its present range for longer”. As a result, we see a very strong likelihood that the Fed will try to backtrack away from this 6-month reference, similar to when Ben Bernanke cited last year that QE3 would come to an end when the unemployment rate reached ‘about 7.0%’, and rely more on their new ‘qualitative forward guidance’. Interestingly, numerous Fed members have spoken since the March meeting, and the language has so far been mixed.
Key Fed Bullets since March FOMC meeting:
- Fisher: Won’t put timeframe on beginning of rate hikes – Fed to raise rates at the “right time”
- Fisher: Rate rise to be quite some time after Asset Purchases end
- Bullard: Fed Chairman Yellen’s “6-month” comment is in-line with surveys
- Plosser: Doesn’t think Fed changed position on rate hikes – Surveys show ‘6 months’ is not a wildly unexpected time frame
- Plosser sees QE coming to an end ‘in the fall sometime’ – Timing of rate hikes depends on the state of the economy
- Lockhart sees first rate hike more than ‘6 months’ after the end of QE – Expects rate hikes in Q2 2015
- Lockhart: Monetary policy to be very accommodative after first rate rise
On Monday, March 31st, Fed Chairman Yellen is scheduled to speak at 9:55am ET and while the topic of discussion is currently uncertain, the market will be watching this carefully to see if she tries to clarify her ‘6-month’ reference or if the language will shift and focus more on the Fed’s dual mandate. Interestingly, this past Friday we received data on the Fed’s preferred inflation measure, US PCE, which for the month of February came in at +0.1% m/m & +0.9% y/y, which were both in-line with expectations, however it should be noted that this measure was down from +1.2% y/y in January. As a result, this is a far cry from the Fed’s 2.0% inflation threshold and thus could garner more lip service next week.
Additionally, this coming Friday the US Bureau of Labor Statistics will release their March Employment report. This is of particular significance because it should be the first data point in 2014 which is unlikely to see any ‘weather-related’ effects. However, this will not be witnessed in the headline NFP number or the unemployment rate – See our detailed how the BLS states “bad weather” influences the NFP number; but rather may be witnessed in US aggregate weekly hours. Some argue this is one of the key metrics the Fed should be using to determine the health of the labor market, rather than the unemployment rate or headline NFP number, because it measures the total labor required to produce real GDP. The rationale behind this is that an employer is more likely to scale back or increase an employee’s number of hours worked before deciding to add or reduce the number of people employed; hence some believe it is a leading employment indicator, however for these same reasons it is also more susceptible to a ‘severe weather’ impact. The good news is that if we are correct in our analysis, and weather played a role in impacting aggregate weekly hours, then as the weather improves it would seem plausible to expect this metric to rebound back to levels witnessed in the latter part of 2013. Accordingly, Friday’s US employment report could indicate the first step back in aggregate weekly hours.

Look Ahead: Stocks
The Dow is again approaching the upper end of a consolidative triangle pattern that it has been stuck inside since the start of the year. Triangles are considered continuation patterns and, if formed on higher time frames, which is the case with the Dow, they usually precede major break outs.
A triangle is in some ways a graphical representation of a balanced market for that period of time. However, the small higher lows inside this pattern, as can be seen on the daily chart of the Dow, suggest the market may be gearing up for another rally. This may especially be the case as the two converging trend lines are fast approaching their point of intersection, or apex. In other words, the index will soon have to break out of this pattern in one direction or the other.
Meanwhile the Relative Strength Index (RSI) is approaching its own corresponding trend line. This is also worth watching as a potential break of the trend on the RSI could lead the index higher.
If and when the Dow breaks out of the triangle, the initial levels to watch for potential resistance would be the previous highs of around 16510/5 and 16585/90. The Fibonacci extension levels of the move down from those highs would then become in focus. As per the daily chart, below, the first three Fibonacci levels are at 16659/60, 16845 and 16927/30.

Look Ahead: Commodities
Gold has fallen sharply for a second consecutive week to reach its lowest level since February 10. Over the past nine sessions, the yellow metal has only managed to rise on two occasions and was slightly lower on Friday morning when this report was written. The sharp sell-off has partly been due to the unwinding of some “safe haven” bets that were placed in the run up to and during the height of the crises in Ukraine. Although this remains a concern for oil speculators – with the West threatening to reduce their energy reliance on Russia – gold investors have found it difficult to justify holding bullion when global inflation is low and falling. What’s more, the era of ultra-easy monetary policy from the Fed is fast approaching its conclusion. This came into focus last week when Janet Yellen, the new Fed chair, surprised the markets by stating a specific timescale for the first rate hike after the end of the tapering process (i.e. 6 months).
However, demand from China in particular remains solid for the yellow precious metal, and that fact is likely to prevent prices from falling more significantly. Indeed, China imported a healthy 125 tons of gold from Hong Kong in February alone. Net imports of more than 112 tons was the highest amount recorded since October and almost double from the year-ago period. Significantly, imports of gold from Hong Kong in February were easily more than January when demand for jewellery had risen ahead of the Lunar New Year Celebrations. Meanwhile, outflows from the world’s largest gold ETF, SPDR Gold Trust, have only been moderate this week – totaling just 4.5 tons over the past four days. This suggests that the physical demand is still there for gold, and that selling from financial speculators in the paper market may be the primary cause for the slide in prices. The CFTC’s market positioning data (due to be published on Friday evening) is therefore expected to show a sharp fall in net long positions from speculators.
As a result of the recent selling pressure, gold’s technicals are all of a sudden looking anything but constructive. A bullish trend line has been eroded while key support levels such as $1320 have also been taken out. The yellow metal has broken its 50-day moving average ($1306/7) and is currently also below the 200-day average at $1295/6. However, these moving averages are now in the correct order as far as a bull market is concerned. So, if gold finds its feet soon and rallies back above the old support levels such as $1307 and $1320, then the trend would change back to bullish. At the time of this writing, the yellow metal was testing the $1285/90 support range where a couple of short-term Fibonacci extension levels converge with the 50% retracement of the up move that started on the last trading day of 2013. This area is therefore an ideal point for short-side profit-taking, especially ahead of the weekend and month-end. A potential break below here though could pave the way for a move towards the 100-day moving average, which comes in just below the next logical support level of $1275.

Data Highlights
Monday, March 31, 2014
9:28 GMT NZ Feb. Building Permits
- The market expects this to rebound by +2.0% from -8.3% m/m in January. This is of particular importance since the RBNZ’s macro-prudential measures were targeted at New Zealand’s rapidly rising housing market.
9:00 GMT EU March Advance CPI
- The German March Preliminary CPI reading on Friday showed that inflation slowed to 1.0% y/y from 1.2% in February. If this is occurring in the Eurozone’s largest economy, then it could be an ominous sign for overall inflation in the EU as a whole. Should this disappoint, it could reignite disinflationary fears and may cause the ECB to take action at their meeting later in the week.
13:45 GMT Fed Chairman Yellen Speaks
- After referencing that a ‘considerable period’ could be something on the order of ‘6-months’ in her first press conference as Fed Chairman two weeks ago, the market will be closely watching this speech to see if this language is altered or tweaked in any way.
Tuesday, April 1, 2014
1:45 GMT China HSBC March Final Manufacturing PMI
- The preliminary read of this measure showed that Chinese manufacturing contracted for the third month in a row, intensifying the fears that the second largest economy in the world may be slowing down. While this final figure is unlikely to significant deviate from the 48.1 preliminary reading, it could serve as a continued reminder that the PBoC may need to be more accommodative if it wants to reach their 7.5% growth rate in 2014.
3:30 GMT Reserve Bank of Australia Rate Statement and Interest Rate Decision
- At their last meeting the RBA made it evident that their decision to keep rates at 2.50% was one that is likely to persist for some time as they stated “the most prudent course is likely to be a period of stability in interest rates”. Since their last meeting, Australia’s February Employment report was released and it was a bombshell – Employment change: +47.3K vs. expected +15K & Jan. was revised higher from -3.7K to 18.0K, and the Unemployment rate remained at 6.0% even though the participation rate increased to 64.8% from 64.6%. As a result, we expect the RBA to reiterate their neutral stance which could be slightly Aussie bullish.
14:00 GMT US Mar. ISM Manufacturing PMI
- While the intent of this report is to tell us about the strength of the manufacturing sector of the US economy, most investors simply dive in to the guts of the report and dig out the Employment Subcomponent. Being that the all-important NFP employment report won’t be revealed until the end of the week, this release gives us a sneak peak at what the week ending report might tell us and is used as a barometer for expectations.
Wednesday, April 2, 2014
12:15 GMT US Mar. ADP Employment Change
- This is one of the most reliable leading indicators for the all-important NFP read and is the determining factor for NFP estimates for many economists. This is expected to show a pickup from 139K jobs gained in Feb. to 190K in March. Additionally, watch for a potential upward revision to the prior number, as last month’s NFP came in at 175K.
Thursday, April 3, 2014
11:45 GMT European Central Bank Interest Rate Decision and Press Conference
- While no change is expected at this meeting, some are speculating that the ECB will need to shift to a more dovish stance, either via Quantitative Easing or Negative deposit rates, sooner rather than later to combat disinflationary fears. While this is unlikely to be shown in their decision, it could come in ECB President Draghi’s press conference at 12:30 GMT.
14:00 GMT US ISM Non-Manufacturing PMI
- The service sector is the largest provider of employment in the US economy and much like the ISM Manufacturing PMI that is released earlier in the week; the non-manufacturing version also provides an Employment Subcomponent. While the headline number is important, many traders will be diving into the details of this report to get a better feel on the employment situation heading into Friday.
Friday, April 4, 2014
12:30 GMT US March Employment report
- This is of particular significance because it should be the first data point in 2014 which will not see any ‘weather-related’ effects. If another strong report is released, the Fed could rest soundly knowing that their decision to shift to a qualitative stance was the correct one and that their current pace of Quantitative Easing will remain on course. Additionally, keep an eye on the US aggregate weekly hours, as some argue this is one of the key metrics the Fed should be using to determine the health of the labor market, rather than the unemployment rate or headline NFP number, because it measures the total labor required to produce real GDP. If weather played a role in impacting US employment over the past few months, then it is plausible to expect this metric to rebound back towards levels witnessed in the latter part of 2013, and thus investors could have more confidence that the US economy is heading in the right direction.
General Risk Warning for stocks, cryptocurrencies, ETP, FX & CFD Trading. Investment assets are leveraged products. Trading related to foreign exchange, commodities, financial indices, stocks, ETP, cryptocurrencies, and other underlying variables carry a high level of risk and can result in the loss of all of your investment. As such, variable investments may not be appropriate for all investors. You should not invest money that you cannot afford to lose. Before deciding to trade, you should become aware of all the risks associated with trading, and seek advice from an independent and suitably licensed financial advisor. Under no circumstances shall Witbrew LLC and associates have any liability to any person or entity for (a) any loss or damage in whole or part caused by, resulting from, or relating to any transactions related to investment trading or (b) any direct, indirect, special, consequential or incidental damages whatsoever.
Recommended Content
Editors’ Picks
EUR/USD edges lower toward 1.0700 post-US PCE

EUR/USD stays under modest bearish pressure but manages to hold above 1.0700 in the American session on Friday. The US Dollar (USD) gathers strength against its rivals after the stronger-than-forecast PCE inflation data, not allowing the pair to gain traction.
GBP/USD retreats to 1.2500 on renewed USD strength

GBP/USD lost its traction and turned negative on the day near 1.2500. Following the stronger-than-expected PCE inflation readings from the US, the USD stays resilient and makes it difficult for the pair to gather recovery momentum.
Gold struggles to hold above $2,350 following US inflation

Gold turned south and declined toward $2,340, erasing a large portion of its daily gains, as the USD benefited from PCE inflation data. The benchmark 10-year US yield, however, stays in negative territory and helps XAU/USD limit its losses.
Bitcoin Weekly Forecast: BTC’s next breakout could propel it to $80,000 Premium

Bitcoin’s recent price consolidation could be nearing its end as technical indicators and on-chain metrics suggest a potential upward breakout. However, this move would not be straightforward and could punish impatient investors.
Week ahead – Hawkish risk as Fed and NFP on tap, Eurozone data eyed too

Fed meets on Wednesday as US inflation stays elevated. Will Friday’s jobs report bring relief or more angst for the markets? Eurozone flash GDP and CPI numbers in focus for the Euro.