Nasdaq 100 Short-Term Technical Analysis

The NASDAQ 100 index fell nearly 6% during the past few training days. That's the biggest correction since April of this year. Financial media quickly came up with an explanation for the drop. They suggested that rising interest rates are responsible for the recent losses in equities.
We're not saying that fundamentals don't matter at all. However, they can disappoint especially on short time frame intervals. Our experience thought us that the same media experts will find ex-post explanations for almost everything. Imagine if we see a 25bp yield rise in 10y US Treasuries along a 10% increase in the NASDAQ 100 within the next couple of weeks. A strong economy justifies this scenario very well. All in all, yields rose along with equities for the past few years. Their relationship is more complex than a simple negative correlation.
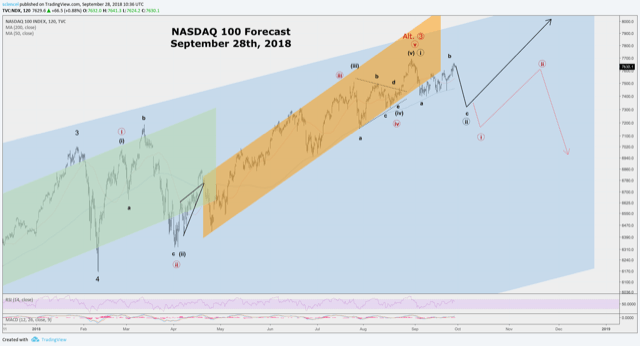
Our technical analysis framework, Elliott wave analysis, keeps us mostly away from the daily noise that tries to explain each end every market fluctuation. Instead, we focus on the life cycle of trends as well as shorter-term pattern recognition. The NASDAQ 100 is another good example of how this works. The chart attached to this article is from our short-term analysis, which we send out to clients on September 28th. It shows two possible price paths that we judged to be the most probable for the NASDAQ 100. As it turned out, the subsequent market drop went almost exactly along the price path that we anticipated. Moreover, the market shows its biggest bounce from around 7200 points. Our analysis remains valid despite being written more than a week ago as we publish this.
We remain bullish on the NASDAQ 100 and the black path remains the most probable. It implies that the US tech index is poised for another stretch into 2019. The alternative is depicted by the red path. That was our best alternative interpretation of the market. It warned of a potential cyclical top at that junction!
Multiple time-frame analysis, as well as specific targets for the black path, are subject to our premium analysis. More important, we also assess which action is necessary to shift odds from the black path away and in favor of the red path.
Interested in more of our ideas? Check out Scienceinvesting for more details!
Interested in more of our ideas? Check out Scienceinvesting for more details!
Author

Science Investing Team
Science Investing


